
Figure 7.
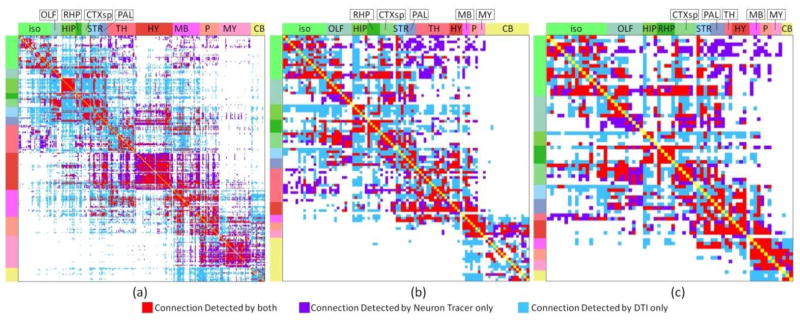
Comparison of mouse brain ipsilateral connectome derived from neuron tracer or DTI using different percolation schemes. For neuron tracer, when the p-value of correlation coefficient between an injection site and a projection site is larger than 0.05, the projection will be identified as from the injection site to the projection site. For DTI, when number of fibers connected between two regions is larger than the threshold, these two regions were identified as being connected. The optimal threshold is selected based on the ROC curve accordingly. DTI tractography was performed based on the following parameters: FA threshold: 0.1, angular threshold 40. (a) 300 regions. (b) 96 regions. (c) 69 regions. The red color represents common connections detected by both approaches. The violet color represents connections detected by neuron tracer only. The azure color represents connections detected by DTI only.