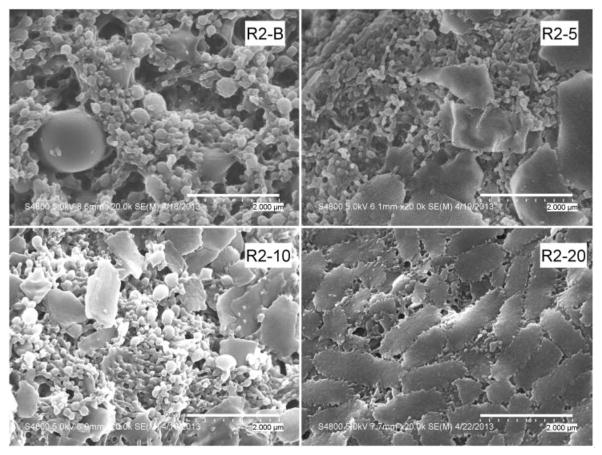
Figure 2.
SEM micrographs of R2 formulations (acid terminated PLGA). Sample magnification is 20,000. As with the R1 formulations, the appearance of agglomerations in the sample increases with increasing drug content. Magnification of the R2-20 sample shows these plate-like structures to be agglomerates of smaller particles.

