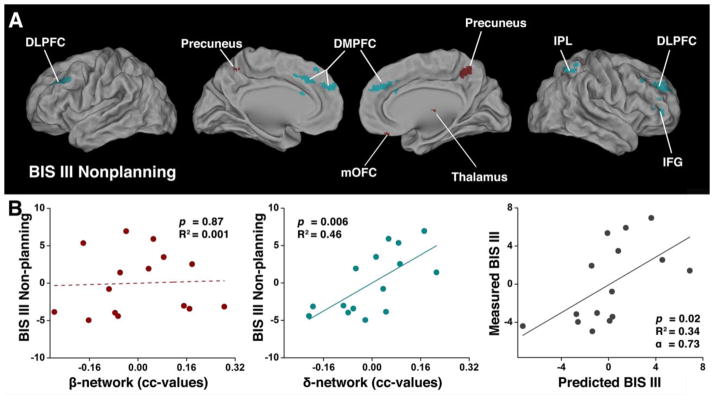
Fig. 4. The behavioral (BIS-III Nonplanning) significance of the balanced β- and δ-networks in CN subjects.

(A) Overlapping regions from the conjunction analysis among 1) the neural correlates of impulsivity measured with the BIS-III Nonplanning score; 2) the difference maps in vmPFC-based functional connectivity between NC and HD groups; and 3) the predefined regions of β- and δ-networks. The red color represents the spatially segregated β-network components and the cyan color represents the spatially segregated δ-network components. (B) The two-dimensional scatterplots of multivariate linear regression model with integrated β- and δ-network indices (BIS=α0+α1β+α2δ+ε) for CN subjects. The β-network index did not correlate with impulsivity (left panel). In contrast, the δ-network index positively correlated with impulsivity (middle panel), measured by the BIS-III Nonplanning score. The multivariate linear regression model was cross-validated with the LOO method (right panel).
