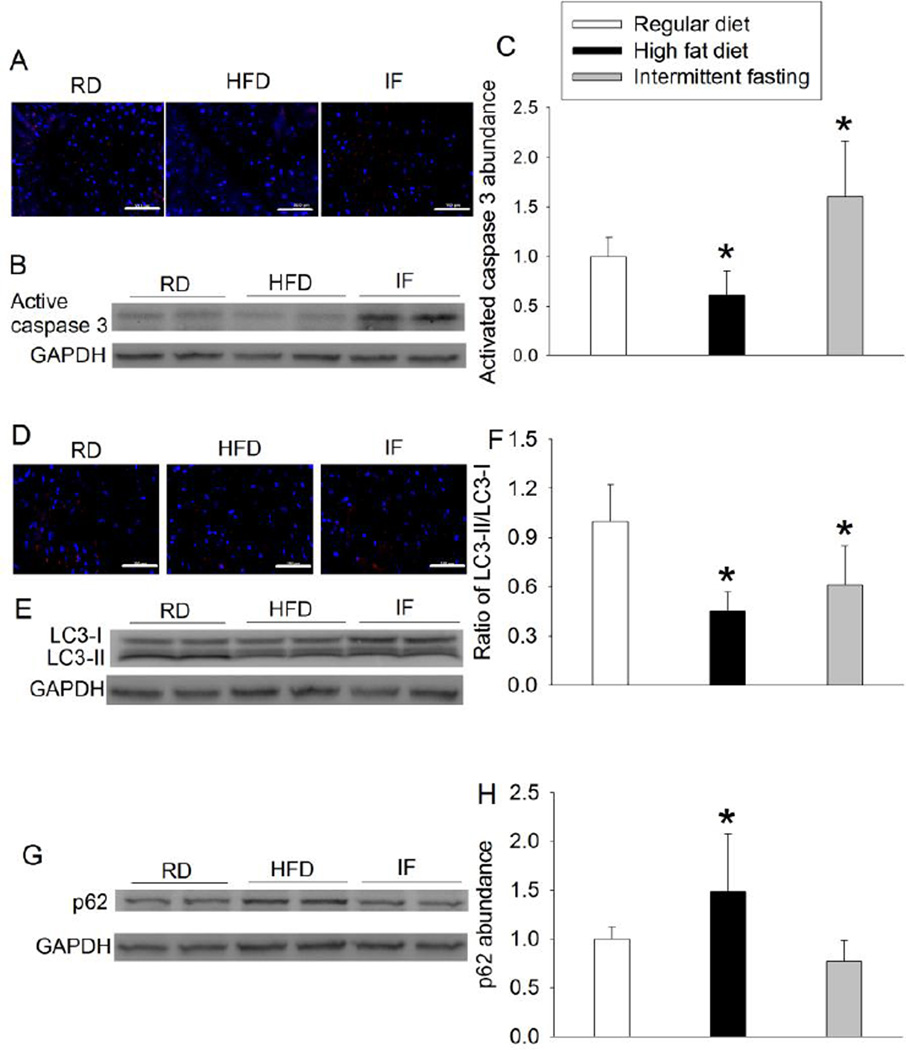
Fig. 2.
Effects of HFD and intermittent fasting on the expression of active caspase 3, LC3 and p62 in the left ventricle. A: representative images of active caspase 3 immunostaining. Active caspase 3 is stained in red and Hoechst 33342 staining is in blue. Scale bar = 100 µm. B: Western blotting image of active caspase 3. C: quantification of active caspase 3 protein. D: representative images of LC3 immunostaining. LC3 is stained in red and blue color is Hoechst 33342 staining. Scale bar = 100 µm. E: Western blotting image of LC3. F: ratio of LC3-II/LC3-I proteins. G: Western blotting image of p62. H: quantification of p62 protein. Results are means ± S.D. (n = 6 for panels C and F, = 8 for panel H). * P < 0.05 compared with control. RD: regular diet, HFD: high fat diet, IF: intermittent fasting.

