
Figure 1.
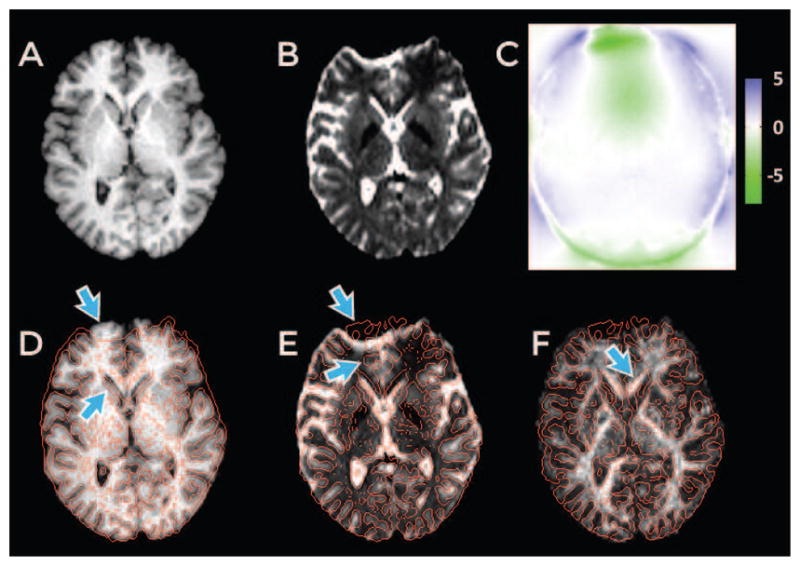
Example of distortion in a human brain T2W-EPI image acquired with EPI sequence. (A) An undistorted T1-weighted anatomical image. (B) T2W-EPI image from a diffusion dataset. (C) The displacement map (in millimeters) computed from an acquired fieldmap. Edges from the T2W-EPI image are overlaid in red on the T1-weighted image in (D) and vice-versa in (E) after rigid alignment (using INVERSION approach described later). Arrows point to areas with substantial distortion. (F) The fractional anisotropy (FA) map derived from diffusion dataset overlaid with edges from the T1-weighted image in red.