
Figure 2.
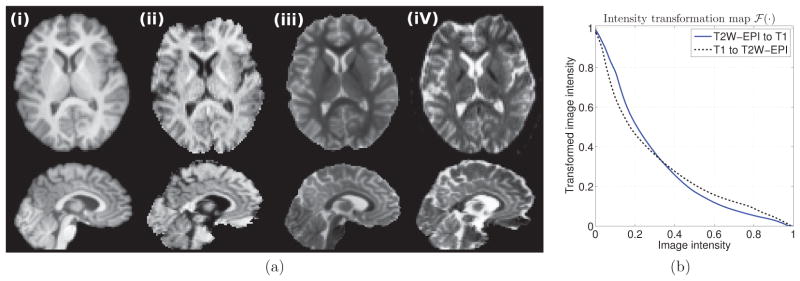
An example of INVERSION in an in vivo dataset. (a) shows corresponding slices from (i) the T1-weighted image, (ii) the intensity transformed T2W-EPI image, (iii) the intensity transformed T1-weighted image, and (iv) the original T2W-EPI image. (b) Intensity transformation maps
 (·) in INVERSION for voxels inside the brain mask for the dataset shown in (a).