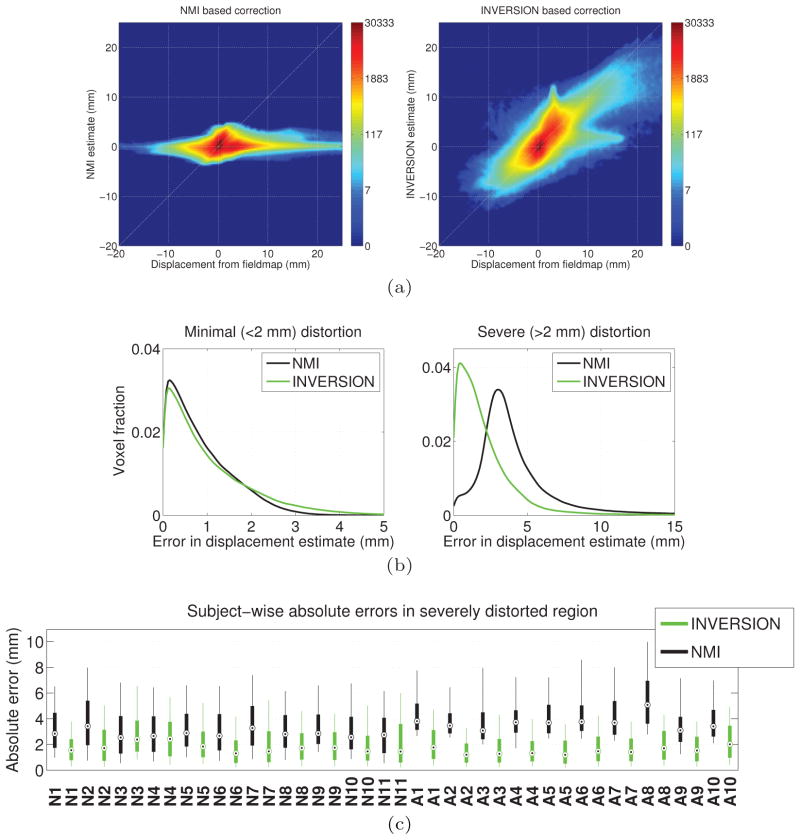
Figure 9.
Performance of registration-based distortion correction with 21 subjects from dataset-2 and 3. (a) The pooled joint-histogram of the reference displacement (calculated from the fieldmap) and estimated displacement using (left) NMI and (right) INVERSION based methods for all subjects. Note that the colorbars use a logarithmic scale. (b) Histogram of the absolute errors in displacement estimate for (left) minimally and (right) severely distorted voxels. (c) Box-and-whisker plot showing the absolute error in the displacement estimated in severely distorted areas for each subject using NMI and INVERSION based distortion correction method. The box extends from 25th to75th percentile with the dot inside the box representing the median error and the whiskers extend from 10th to 90th percentile. Subjects from dataset-2 have labels starting with ‘N’ and subjects from dataset-3 have labels starting with ‘A’.

