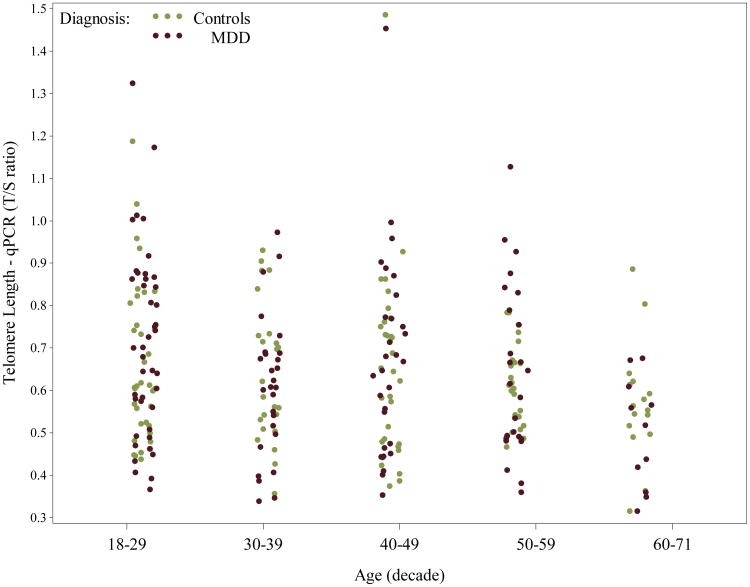
Appendix Figure A3.
Scatterplot of Telomere length, as measured by qPCR (ratio of telomere repeat copy number to a single gene copy number= T/S ratio), by decade of age and diagnosis (each dot/circle represents a subject). Telomere qPCR length was significantly shorter in older participants compared to younger participants overall. For color versions of the figures, please refer to the web version of the article.

