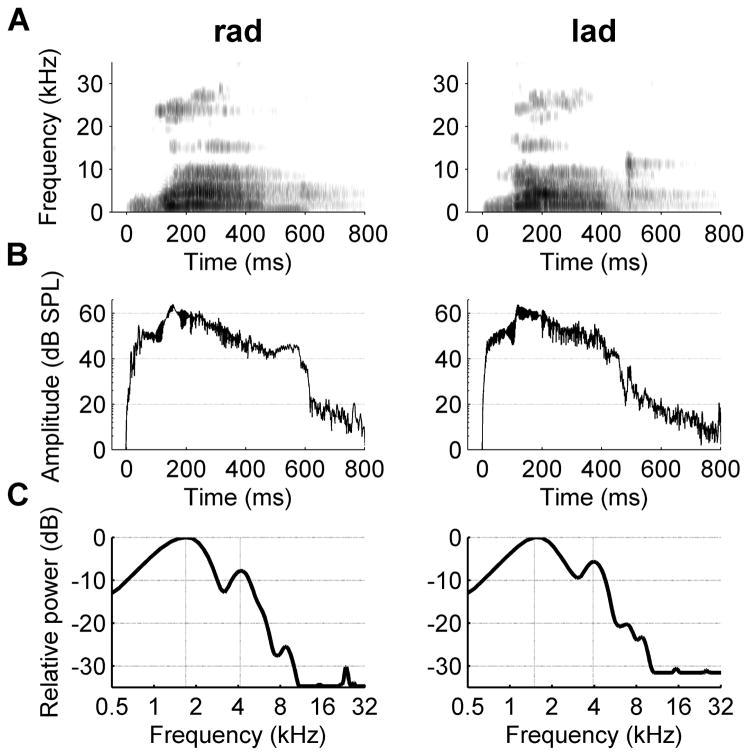
Figure 5.
Spectrograms, amplitude envelopes, and power spectrums for the paired speech sounds ‘rad’ and ‘lad’. (a) The spectrogram for the paired sounds ‘rad’ and ‘lad’. Time is represented on the x axis (−50 to 800 ms), and frequency is represented on the y axis (0 to 35 kHz). The intensity of the sound is plotted so that white is 70 dB SPL quieter than black. The amplitude envelope (b) and power spectrum (c) for ‘rad’ and ‘lad’.

