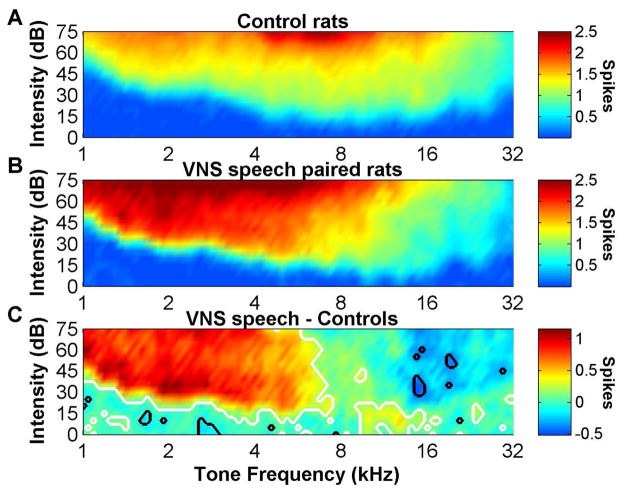
Figure 7.
The number of spikes evoked per tone in VNS speech paired rats increased for low frequency tones and decreased for high frequency tones. (a) The number of spikes evoked in response to any frequency and intensity combination of tones in control rats. (b) The number of spikes evoked in response to any frequency and intensity combination of tones in VNS speech paired rats. (c) The difference in the number of spikes evoked between VNS speech paired rats and control rats. White contour lines surround the tone regions that were significantly increased (false discovery rate was used to correct for multiple comparisons) compared to control rats, while black contour lines surround the tone regions that were significantly decreased compared to control rats.

