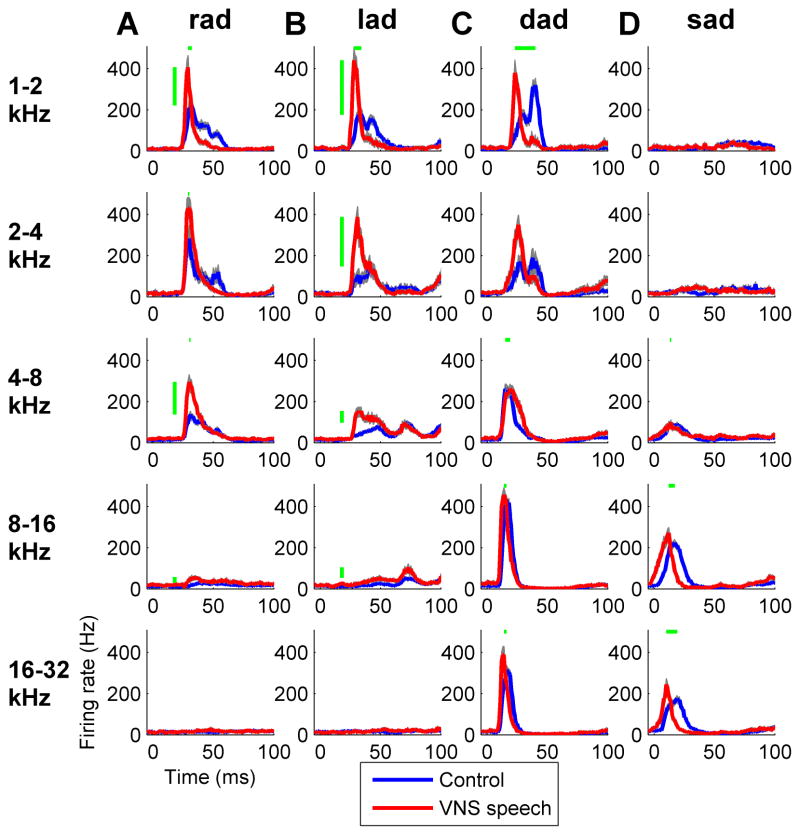
Figure 8.
The onset response to each of the speech sounds across characteristic frequency. The paired sounds ‘rad’ (a) and ‘lad’ (b) evoked a strong response in low frequency tuned neurons. The novel sound ‘dad’ (c) evoked a response across all frequency ranges, while the novel sound ‘sad’ (d) evoked a response in high frequency tuned neurons. Vertical green lines indicate a significantly stronger peak firing rate across recording sites in VNS speech paired rats compared to control rats (Bonferroni correction for multiple comparisons, p < 0.01), while horizontal green lines indicate a significantly altered peak firing latency in VNS speech paired rats compared to control rats (Bonferroni correction for multiple comparisons, p < 0.01). Gray shading behind each line indicates SEM across recording sites.

