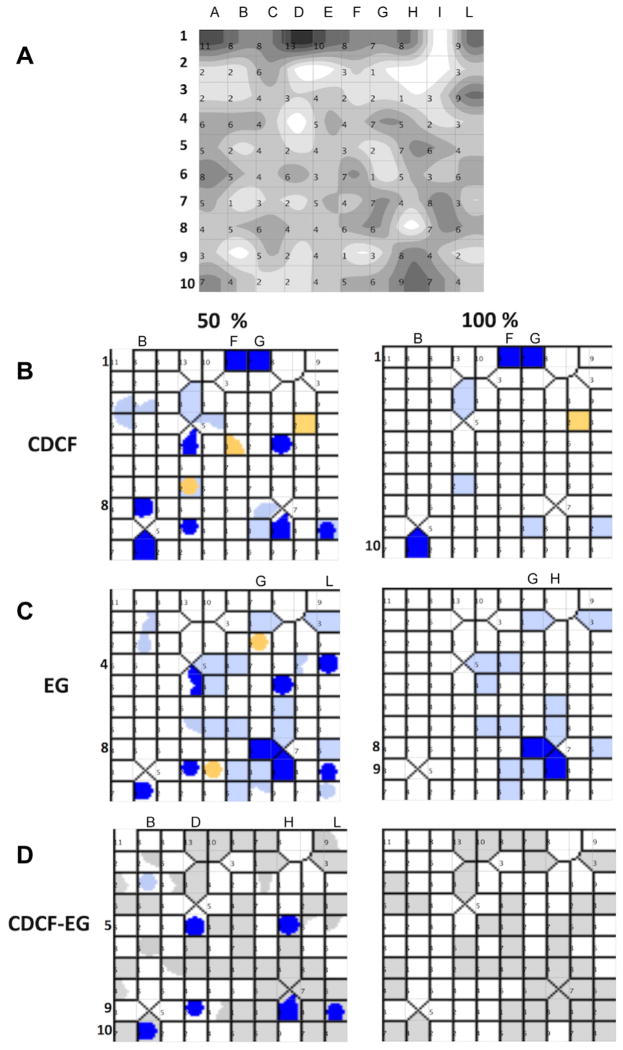
Figure 3.
Modulatory properties of the 432 compounds tested in primary screening mapped on the chemical space using self-organizing maps and Volsurf+ descriptors. (A) Number of compounds present at each node, the darker the node the more molecules are present in the node. 2D maps of CDCF (B) and EG (C) inhibitors and (D) inhibitors of both probes. Nodes contain: inhibitors (dark blue), borderline inhibitors (light blue), inactive (white), borderline stimulators (yellow). Nodes with at least 50% of molecules in the node in the same class (left panels) and nodes with 100% of molecules in the same class (right panels).

