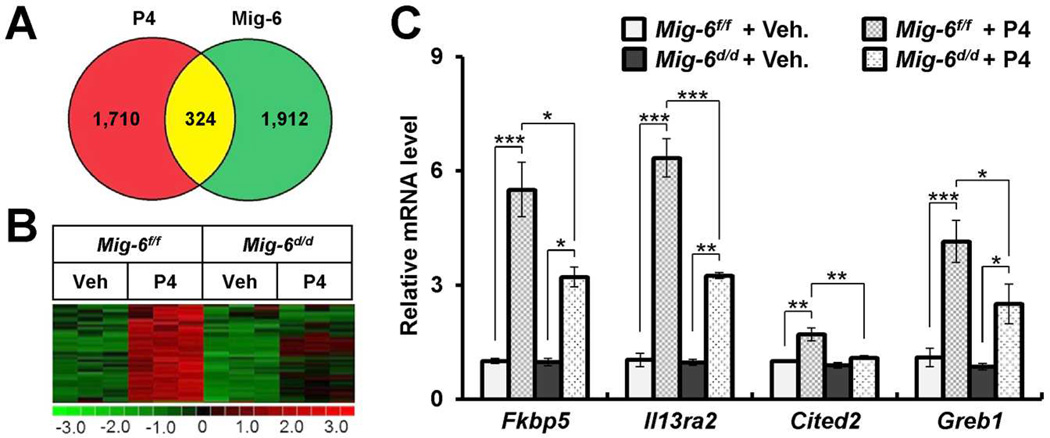
Fig. 3.
Validation of Mig-6 and progesterone regulated genes in the mouse uterus. A) Venn diagrams demonstrating the relationship between genes modulated in the Mig-6f/f and Mig-6d/d uterus in response to acute treatment with P4. Red circles indicate genes selected by vehicle-treated Mig-6f/f vs P4-treated Mig-6f/f; Green, by P4-treated Mig-6f/f vs P4-treated Mig-6d/d. The numbers, displayed within the intersections of the circles indicate the common genes by two comparisons. B) Clustering analysis of Mig-6 dependent induced genes by P4 (p<0.05, 1.2-fold change) in uteri. The extent of gene expression changes is represented by a green-red color scale (green: low expression and red: high expression). C) Quantitative real time PCR analysis of transcript levels of Mig-6 dependent induced genes by P4 in Mig-6f/f and Mig-6d/d mice treated with vehicle or P4 for 6 hours. The results represent the mean ± SEM. * p<0.05, ** p<0.01, and *** p<0.001.

