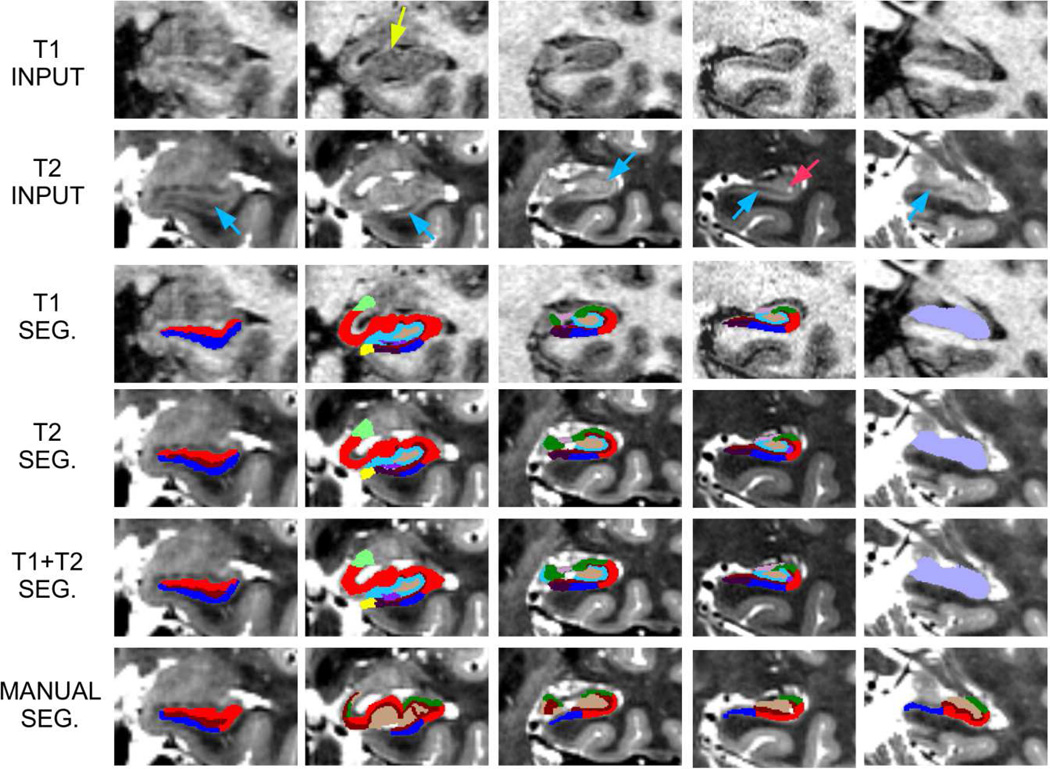
Figure 8.
Sample coronal slices of “subject 3” from (Winterburn, et al., 2013), from anterior (left) to posterior (right). Top row: T1 image. Second row: T2 image. Third row: segmentation computed with the T1 scan. Fourth row: segmentation computed with T2 scan. Fifth row: segmentation computed with T1 and T2 scans simultaneously, overlaid on the T2 images. Bottom row: manual segmentation from the original study. The red arrow marks a CSF pocket, the blue arrows mark the molecular layer, and the yellow arrow marks the medial digitation.

