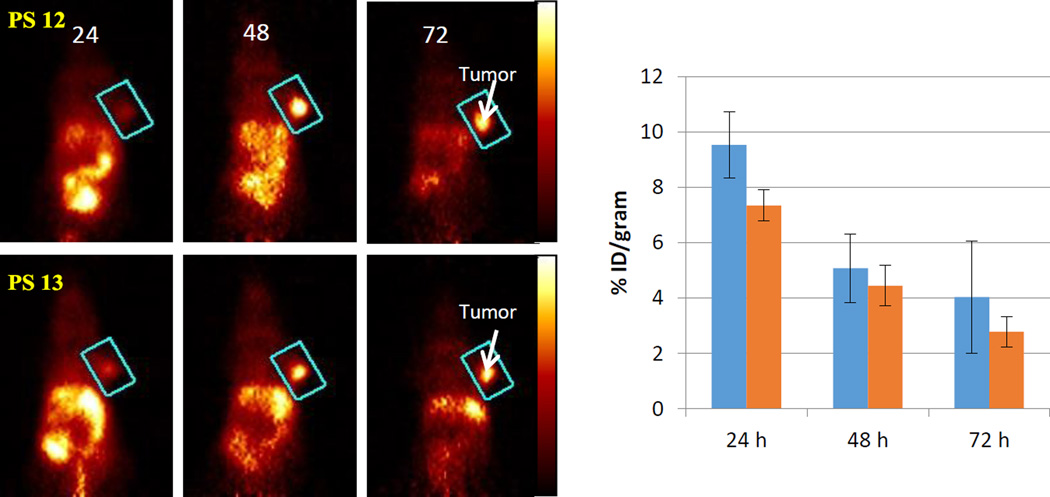
Figure 13.
Coronal view PET images of a BALB/c mouse bearing Colon26 tumor on the right shoulder with labeled 124I-PS 12 or 13 (50µCi). The images were acquired for 30 min at 24, 48, and 72 hours post-injection. The tumor was identified to be within the region defined by a cylinder indicated by the blue rectangle in each image. The color palette (shown on the right) for each image shown was scaled to the min/max of each data set. The tumor uptake (3 mice/group) of the isomers at various time points (24, 48 and 72 hours) is represented in bar graph and shows similar pattern of uptake and clearance. The absolute tumor-uptake was higher at 24 hours post-injection, but tumor contrast was better at 48 and 72 hours post-injection, which could be due to faster clearance of the compounds from other organs than tumor.

