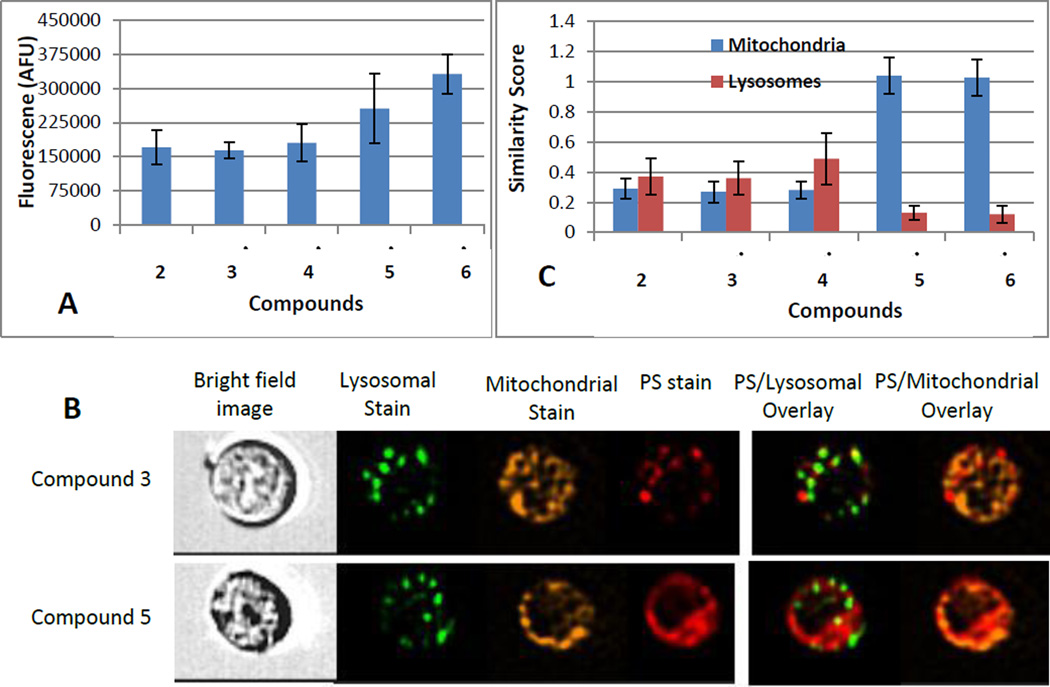
Figure 3.
Uptake and intracellular localization of the compounds 2–6 in colon 26 cells after 24 hour incubation in medium containing 0.8 µM compounds. (A): Total intracellular uptake determined by fluorescence. (B): Representative images from flow cytometry analysis (Image Stream) comparing subcellular distribution of compounds and organelle-tracking dyes. (C): Similarity Score as a measure for co-localization of the compounds with the lysosomal and mitochondrial markers (the higher positive the score the more closely the fluorescent probes co-localize). Data represent the means ±SD of replicate samples from 3 separate experiments).

