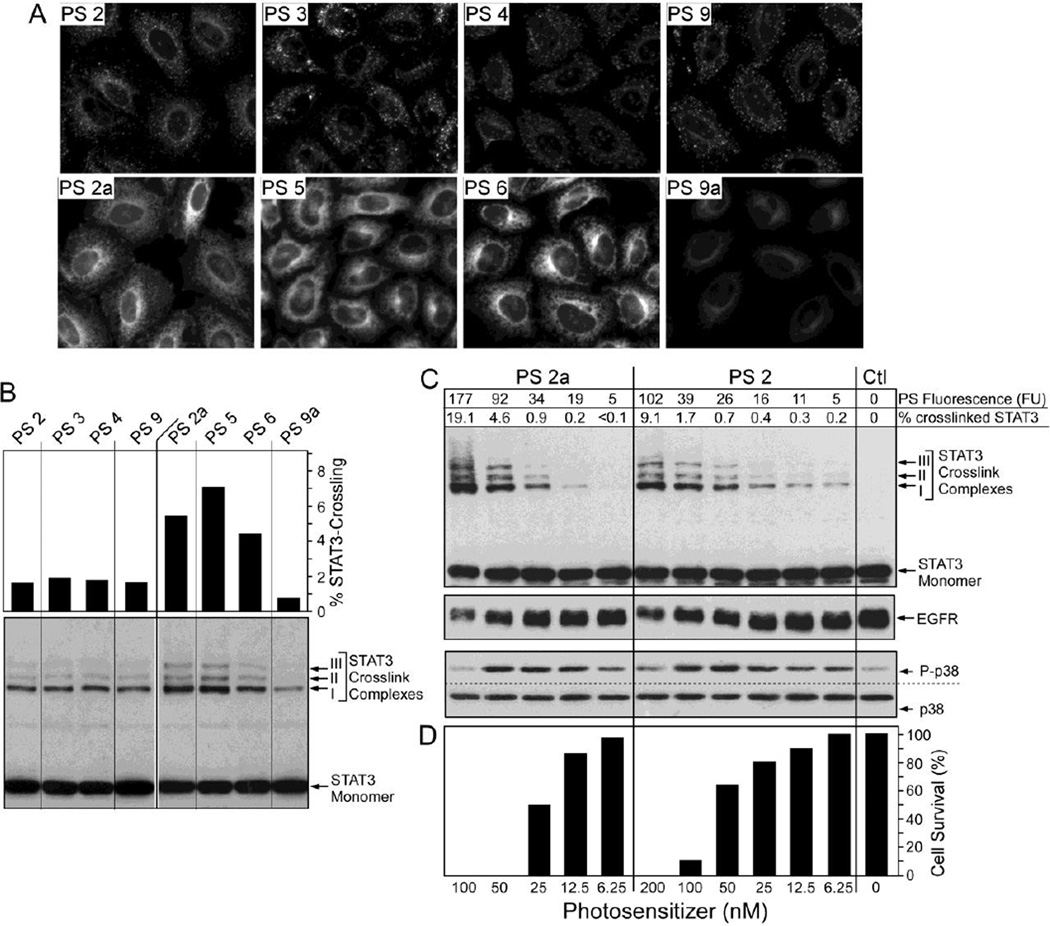
Figure 9.
Correlation of compound uptake and photoreaction. Confluent epithelial cells were incubated for 4 hours with 800 nM (for fluorescent imaging in A) or 100 nM (for biochemical analysis in B–D) compounds listed at the top. After a 4-h chase period, the cell-associated fluorescence was determined by imaging. The cells in B–D were treated with 665nm light (3 J/cm2), extracted and the relative amount of oxidative crosslinking of STAT3 and level of EGFR and phospho- and total p38 MAPK were determined by immunoblotting.

