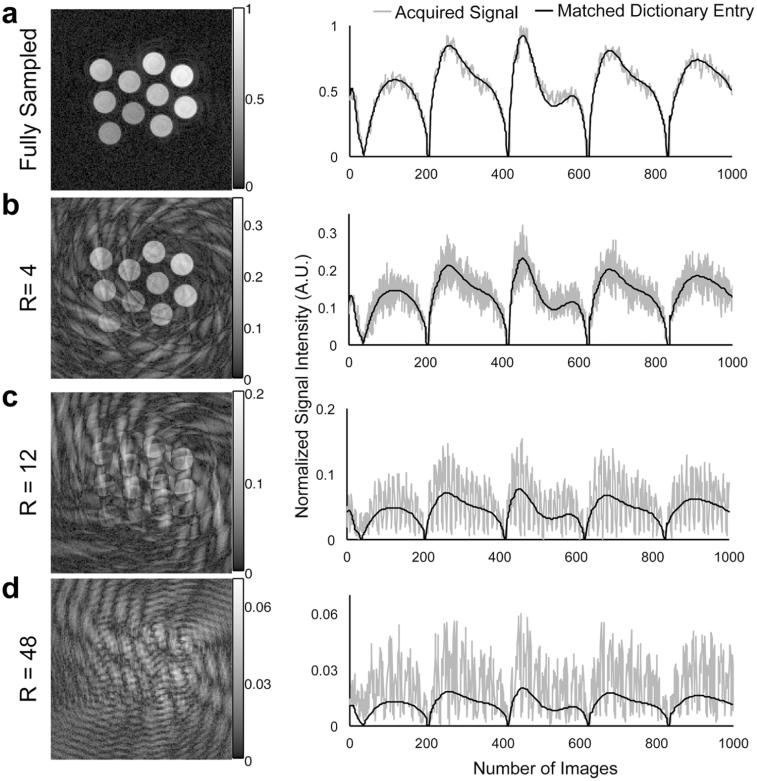
Figure 6.
The representative images, the signal curves of one voxel with T1 of 795 ms and T2 of 85 ms, their matched dictionary entries from a fully sampled data (a), and retrospectively undersampled data at rate (R) of 4 (b), 12 (c), and 48 (d). For comparison of the signal-to-noise ratio among the data with different R, the plotted signals were normalized to the maximum of the fully sampled data.

