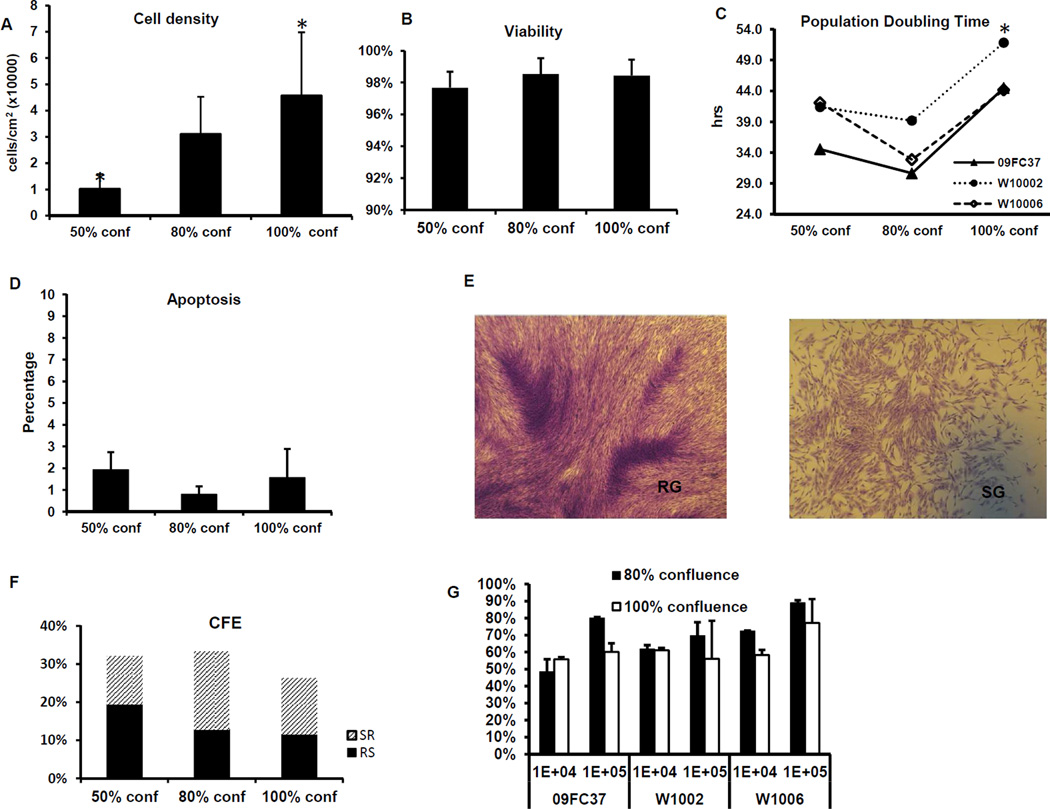
Figure 1. Changes in the phenotypes of 50%, 80% and 100% confluent BMSCs.
The BMSCs were cultured to 50%, 80% and 100% confluences, the cell densities per cm2 culture area were calculated (A) and the viability was determined by Trypan Blue staining (B). In addition, BMSC population doubling time (hours) was calculated (C) and the rate of apoptosis was measured by Annexin V- flow cytometry analysis (D). Representative figures of Rapidly Growing (RG) and Slow Growing (SG) colonies are shown (E). Colony Formation Efficiency (CFE) was counted and the percentage of RG and SG colonies was also shown (F). Immunosuppression of BMSCs of mixed lymphocyte reactions was measured by H3-thymdine incorporation methods; the percentage of suppression was calculated by normalizing the values to the mixed lymphocyte reaction without BMSCs (G). The * indicates p values <0.05 when compared with 80% confluence and the error bars indicate one standard deviation.

