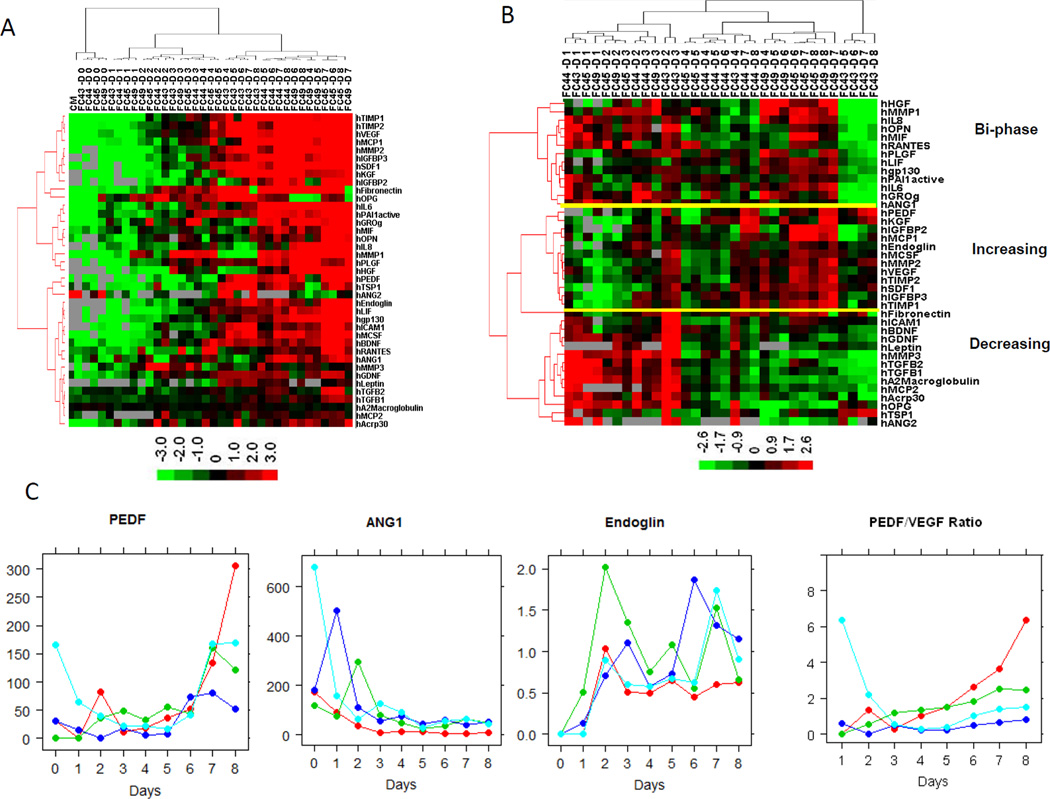
Figure 2. Concentration of proteins in BMSC culture supernatants.
The culture supernatants of 4 BMSCs were collected daily for 8 days and the concentrations of proteins were measured by SearghLight. A heat-map of the unsupervised hierarchical clustering analysis of the raw concentrations of 39 proteins were shown in panel A and the protein concentrations normalized by the cell number in panel B. Representative plots of daily normalized supernatant concentrations of PEDF, ANG1 and Endoglin and the ratio of PEDF/VEGF are shown in panel C. In the heat-map, each row stands for one protein, and each column stands for one BMSC supernatant. The donor ID and day of culture were indicated for each sample on the top of heatmap. CM stands for culture medium.

