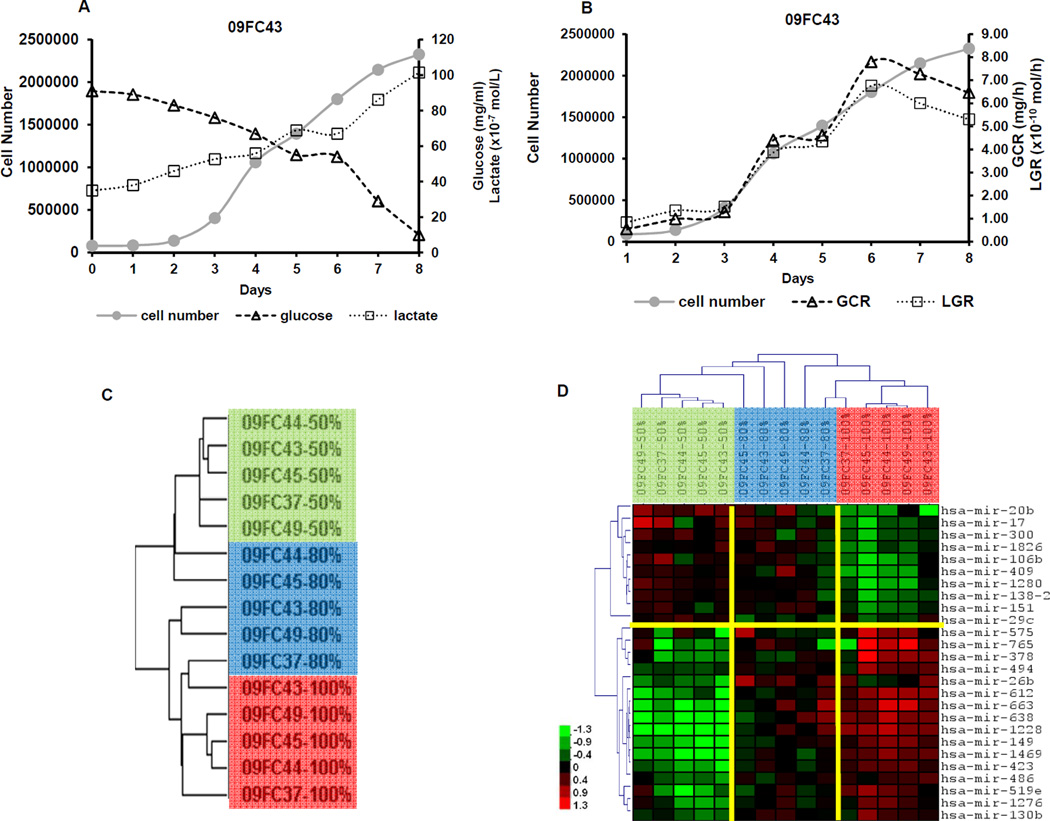
Figure 4. Measuring glucose and lactate in the culture supernatant and microRNA profiling of BMSCs at 50%, 80% and 100% confluence.
The BMSC number and culture supernatant concentrations of glucose and lactate were measured daily from 4 donors; the Glucose Consumption Rate (GCR) and Lactate Generation Rate (LGR) were calculated. Representative plot of raw values (A) and calculated GCR and LGR (B) from one donor, 09FC43, are shown.
Unsupervised hierarchical clustering analysis of 166 informative human microRNA separated samples into clusters of 50% confluence (green bar), 80% confluence (blue bar) and 100% confluence (red bar) (C). Twenty-six differentially expressed microRNAs were identified by Two-way ANOVA (p<0.05). Hierarchical clustering analysis using the 26 microRNA separated the samples into clusters of 50% confluent (green bar), 80% confluent (blue bar) and 100% confluent BMSCs (red bar). The names of the 26 microRNA are shown on the right of each row (D). Scale Bar indicates the expression level.

