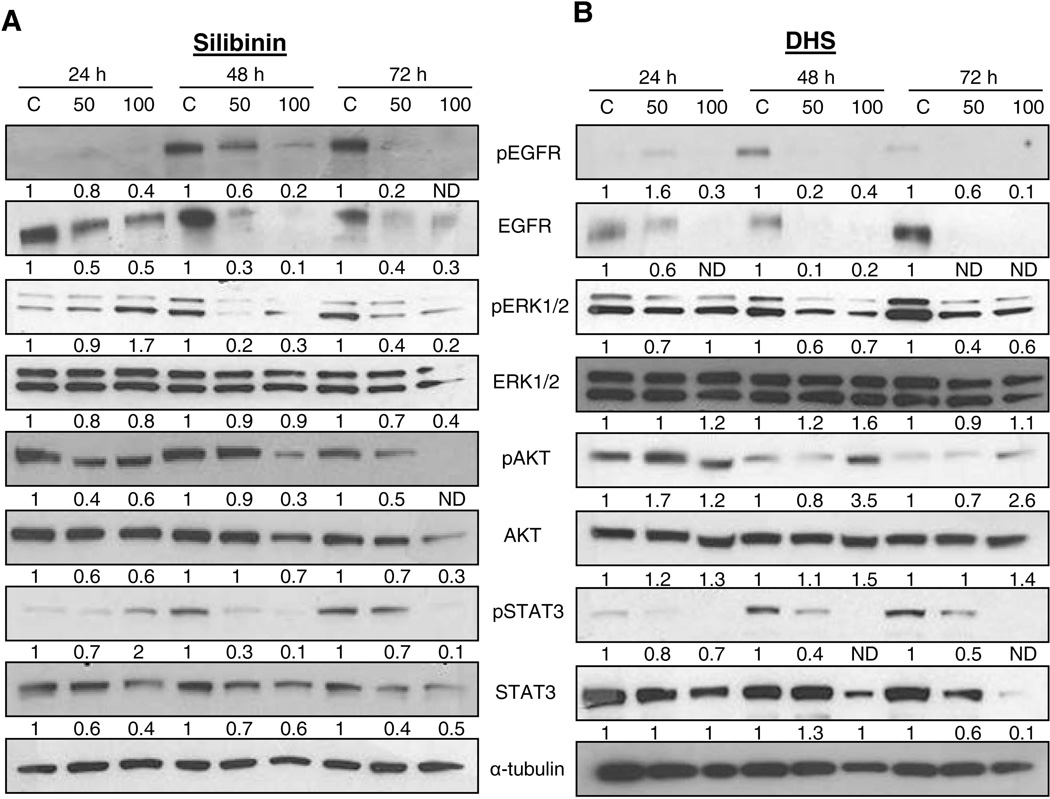
Figure 3.
The effect of silibinin and DHS on mitogenic signaling in ASZ cells. Cells were treated with DMSO, silibinin (25–100 µM), or DHS (10–30 µM) for 24–72 h and total cell lysates were prepared. Lysates were analyzed for p-EGFR, EGFR, p-ERK1/2, ERK1/2, p-AKT, AKT, p-STAT3, and STAT3 in silibinin treated (A) and DHS treated (B) cells. The blots were stripped and re-probed with α-tubulin to confirm equal loading. Densitometry data presented below the bands are ‘fold change’ as compared with control (DMSO treated) after normalization with respective loading control (α-tubulin). ND: Not detectable

