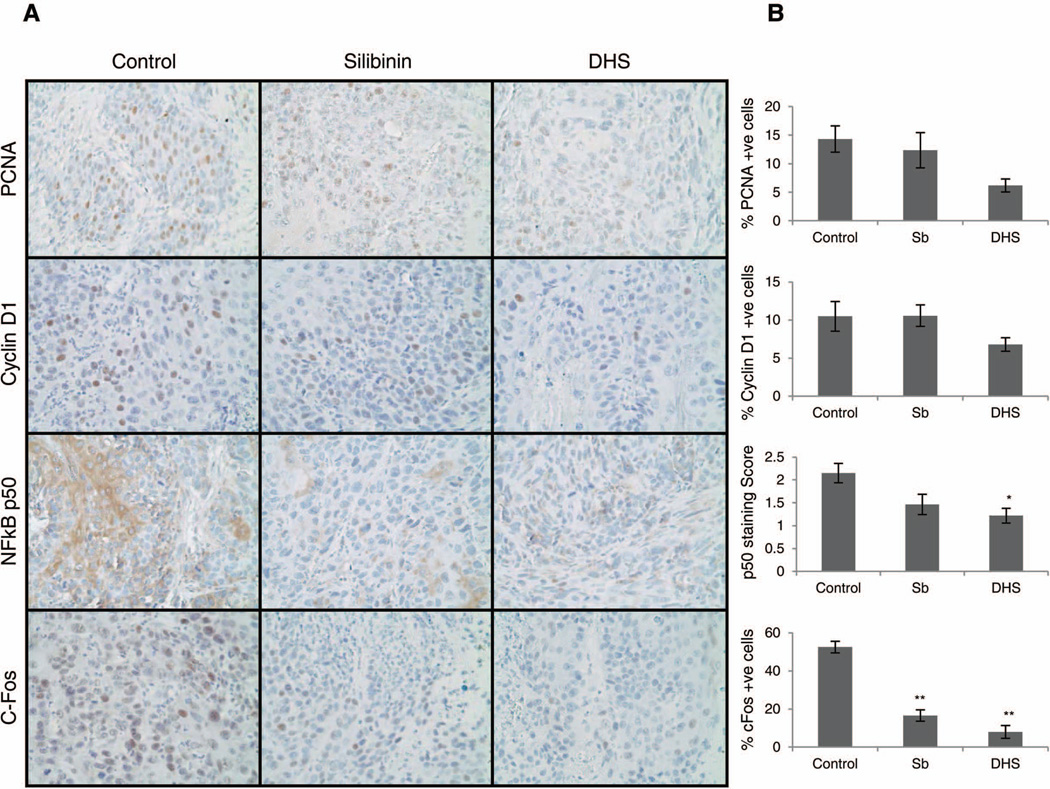
Figure 6.
The effect of silibinin and DHS on in vivo proliferation, NF-κB p50, and c-Fos activation. (A) ASZ allograft tissues from control and treatment groups were subjected to IHC analysis. Representative photographs are shown for PCNA, cyclin D1, NF-κB p50, and c-Fos. (B) Quantitative data for each biomarker showing the mean ± SEM of 7–10 individual tumor samples from each group. *P ≤ 0.05, **P ≤ 0.001, significant with respect to vehicle control.

