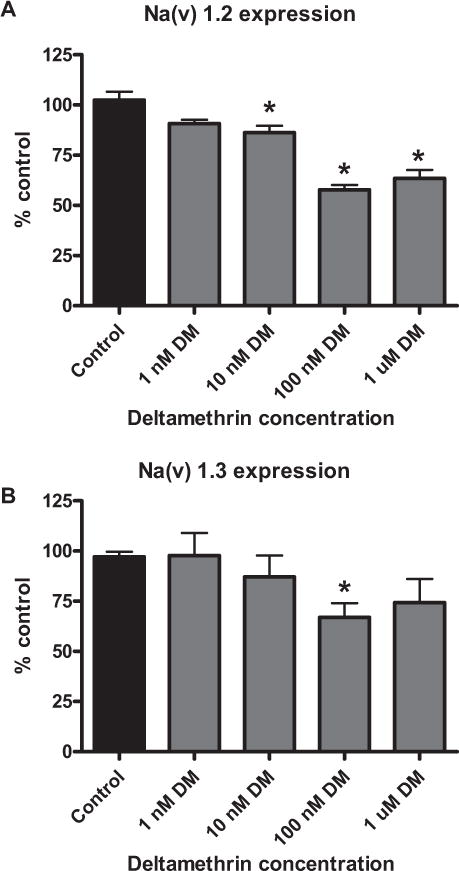
FIGURE 1.

Concentration response for Nav downregulation in SK-N-AS cells. Cells were exposed to deltamethrin for 24 h and mRNA expression determined. (A) Nav 1.2 mRNA expression. (B) Nav 1.3 mRNA expression. Data represent 2ΔΔCt analysis of qPCR data, normalized to control. Significance determined by one-way ANOVA followed by Dunnett’s post hoc test * = p < 0.05 compared to control; n = 3–4. Error bars represent ± SEM
