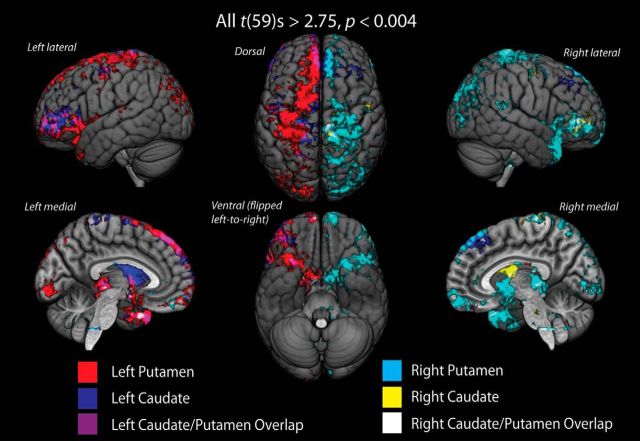
Figure 4.
Cortical endpoint density maps of tractography into each convergence zone mask on template brain. Streamlines were tracked from a whole-brain seed to individual three-way convergence zone masks. Maps show cortical and subcortical regions with consistent (all t(59) values > 2.75, uncorrected p < 0.004) endpoint projections into each convergence zone across all subjects: blue represents left caudate; red represents left putamen; yellow represents right caudate; cyan represents right putamen. Connections with the putamen convergence zone originate from a much larger and more distributed set of cortical areas than those with caudate convergence zone. Overlapping structural connectivity from ipsilateral caudate and putamen convergence zones in OFC, DLPFC, and parietal cortex areas is shown as purple in the left hemisphere and white in the right hemisphere.

