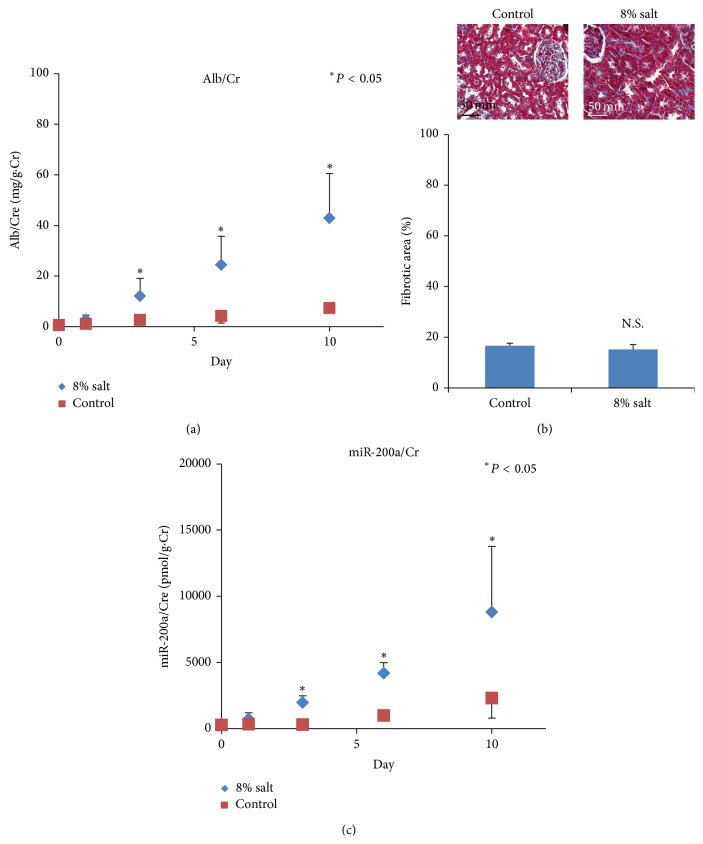
Figure 5.
Assessment of urinary miR-200a in renal tubular dysfunction in rats. Urinary miRNA concentrations were measured with real-time RT-PCR 0, 1, 3, 6, and 10 days after administration of an 8% salt diet. (a) A high-salt diet induced urinary albumin excretion after day 3 of administration. (b) Light micrographs (Masson trichrome staining) of the kidney cortex at day 10. No significant difference in the percentage area of fibrosis was observed. N.S.: not significant. (c) Urinary miR-200a increased after day 3 of administration. The plot with bars shows the mean ± SD. ∗ P < 0.05.

