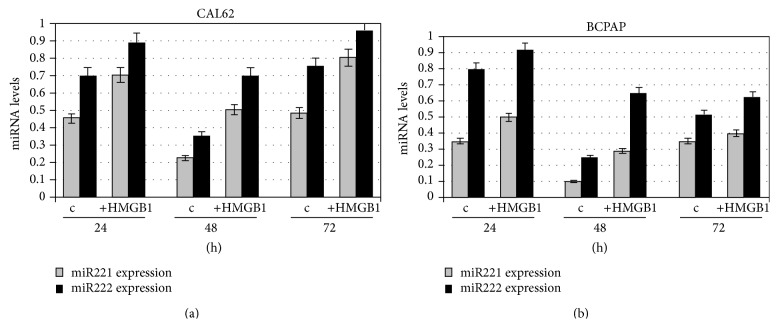
Figure 1.
Expression of miR221 and miR222 in CAL62 and BCPAP cells before and after treatment with HMGB1. CAL62 cells (a) and BCPAP cells (b) were cultured for 24, 48, and 72 h, with or without 10 nM HMGB1 which was added to the culture medium. Expression levels of miRs were detected by real time RT-PCR. miRNAs amounts were quantified by using the ΔΔCt method and normalized with U6b small nuclear RNA (snRNA) expression. Histograms represent the mean values of 3 independent experiments (±SD).

