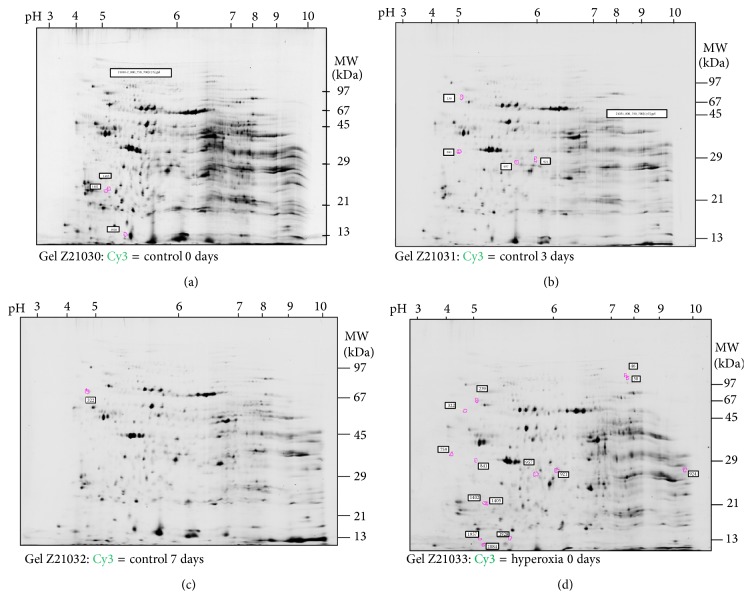
Figure 3.
(a) Differences of spot volumes between control and hyperoxia at day 0, found with DeCyder. (b) Differences of spot volumes between control and hyperoxia at day 3, found with DeCyder. (c) Differences of spot volumes between control and hyperoxia at day 7, found with DeCyder. (d) Summary of all differences of spot volumes between control and hyperoxia samples as found with DeCyder.

