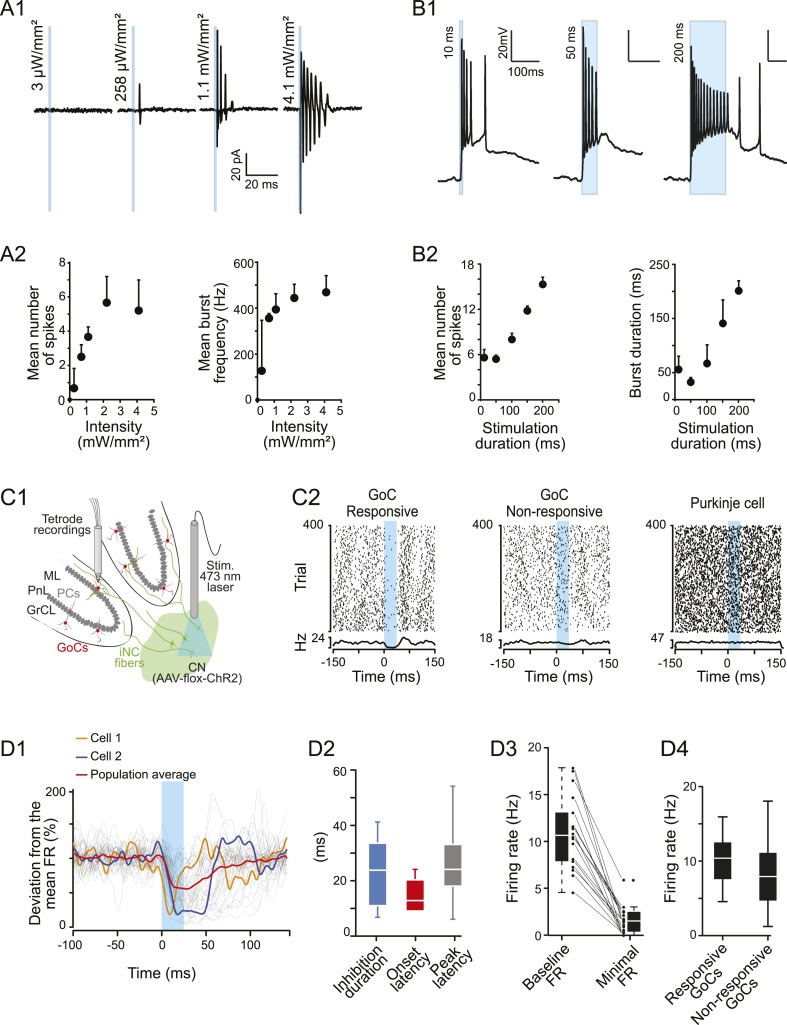
Figure 6. iNC neurons exhibited a burst firing phenotype and their optogenetic stimulation has inhibitory effects on Golgi cells firing in vivo.
(A1) Extracellular recordings of iNC neurons in GlyT2-Cre mice transfected with ChR2 virus during increasing intensity of stimulation (1-ms duration pulse; blue bars). (A2) iNC neurons exhibit a burst firing phenotype with increase of mean number of spikes per burst (left) and mean burst frequency (right) when increasing illumination intensity. (B1) Whole-cell current-clamp recording of GAD-Cre iNC neurons transfected with ChR2 during 10-, 50-, or 200-ms long light pulse (blue bars; light intensity: 1.3 mW/mm2) has burst firing phenotype. (B2) GAD-Cre transfected iNC neurons show increase of their mean number of spikes per burst (left) and mean burst duration (right) with increasing illumination duration. (C1) Schematic drawing of the experimental system for in vivo recordings: extracellular recordings of GoCs during 25-ms pulse illumination of the CN in anesthetized GlyT2-Cre mice injected with ChR2 in the CN. (C2) Raster plots of two GoCs recorded at the same time and of one PN recorded in the same area, with their corresponding PSTH. Light pulse start at 0 ms. (D1) All superimposed smoothed PSTHs of responsive GoCs (18 out of 86 recorded GoCs), normalized to their mean firing rate (FR), with the population average trace (red). Two individual traces are highlighted (orange and blue), illustrating the high variability of the inhibition period parameters. Smoothed PSTHs are obtained by convolving 1-ms time bin PSTHs with a Gaussian kernel with 3 ms standard deviation. (D2) Characterizing parameters of the responses. (D3) Light stimulation of iNC neurons decreased the firing rate. (D4) Comparison of responsive and non-responsive GoCs firing rates. Abbreviations: GoC, Golgi cell.

