
Figure 3.
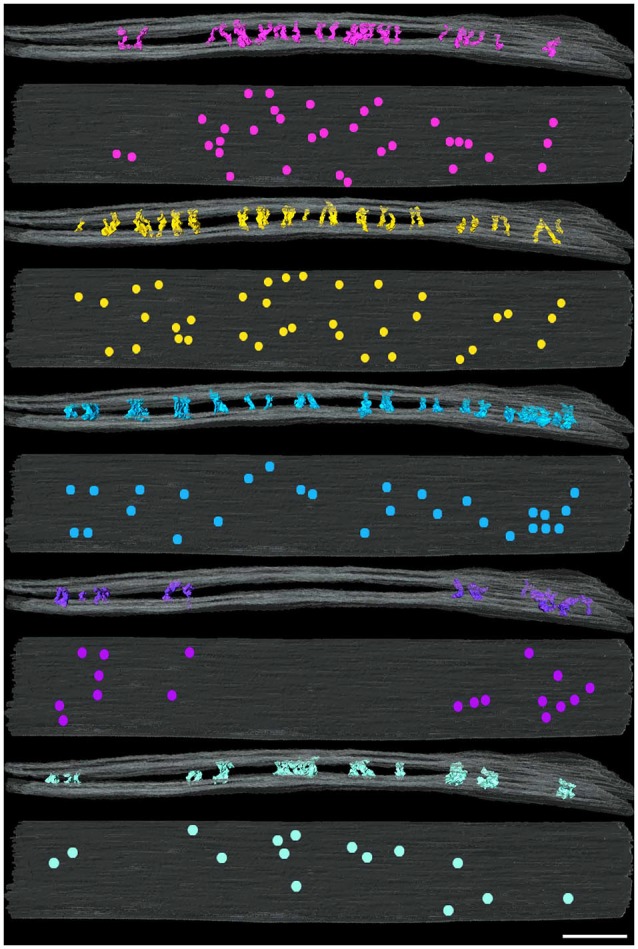
Distribution of cleft elements by type at an excitatory synapse. Side (above) and en face (below) views of synaptic clefts from an excitatory synapse in which each pair of views illustrates the localization for only one of the five types of elements coded as in Figure 2. Each of the five types of elements manifests different distributions in the cleft. Scale bar: 50 nm.