
Figure 5.
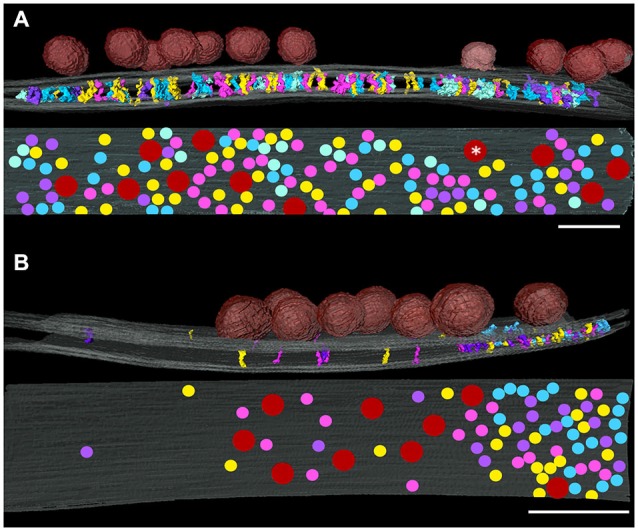
Relationship of the distribution of synaptic vesicles at an excitatory (A) and an inhibitory synapse (B) projected onto presynaptic membrane (gray) as red disks. The white asterisk indicates a vesicle appearing to be fusing on the presynaptic membrane. Contacts of cleft elements with the presynaptic membrane appear to avoid synaptic vesicle contacts. Scale bar: 50 nm.