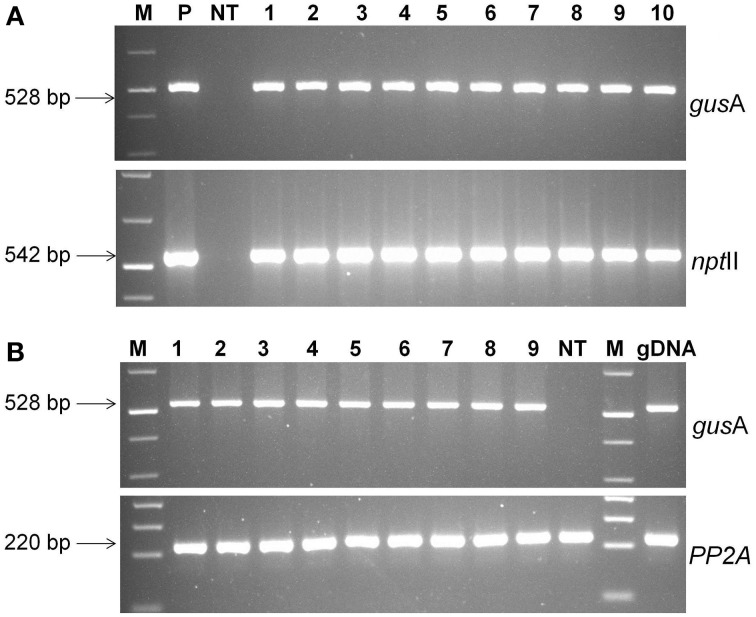
Figure 5.
Molecular analysis of transgenic plants. (A) PCR analysis of putative transgenic lines of cassava using gusA and nptII gene specific primers. Lanes M; 1 kb plus molecular marker (Fermentas), P; pCAMBIA2301 plasmid control; NT, non-transgenic regenerated control plant; 1–10, transgenic lines regenerated, (B) RT-PCR analysis of transgenic cassava lines using gusA and PP2A gene specific primers. Amplified RT-PCR product designations were shown on the right, and products sizes were shown on the left. M, molecular weight marker; 1–9, different transgenic lines and NT, non-transgenic control plant.

