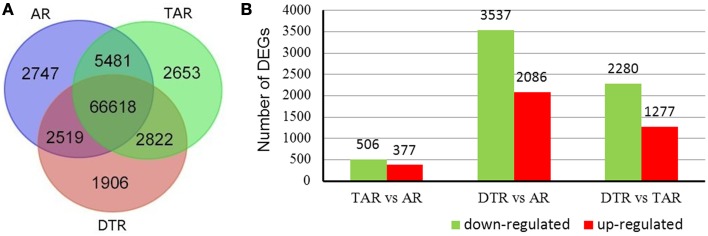
Figure 3.
Venn diagrams of unigenes of three libraries and statistical analysis of the differentially expressed genes (DEGs). (A) Distribution of the unigenes of the three libraries; (B) The red columns indicate the upregulated DEGs and the green columns represent the downregulated DEGs in three pair-wise comparisons (FDR ≤ 0.001 and an absolute value of log2Ratio ≥ 1 was used as the significant threshold for DEGs).

