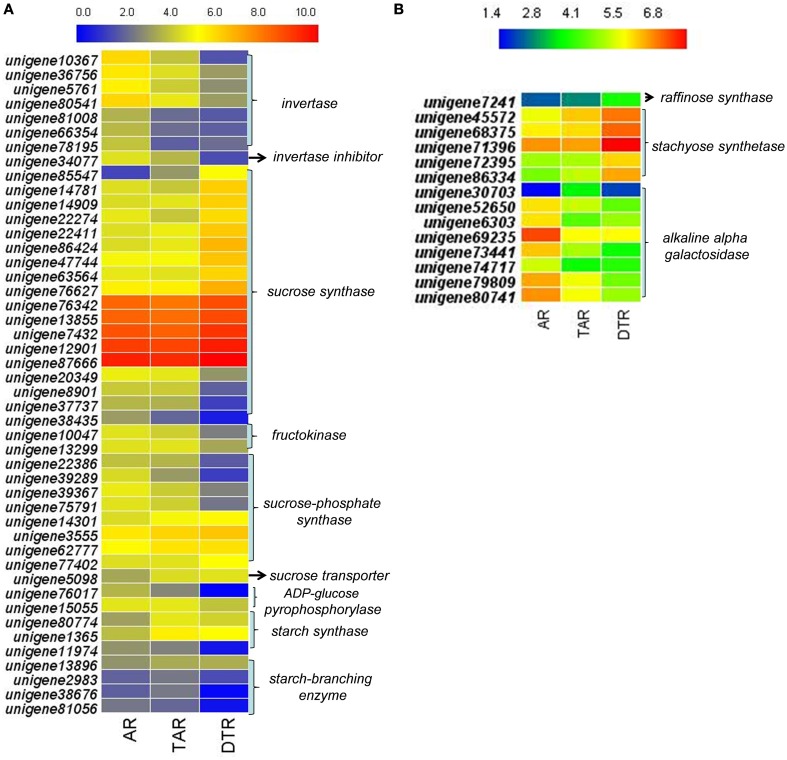
Figure 5.
Heat map of genes in ARs, TARs, and DTRs of R. glutinosa. The expression values were calculated by using the RPKM method and then were log2 transformed prior to the generation of heat maps. (A) The genes related to sucrose and starch metabolism; (B) key genes involved in stachyose metabolism.

