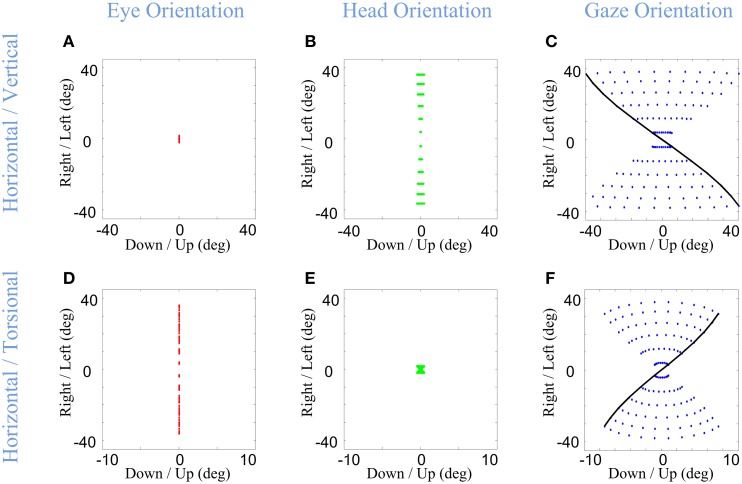
Figure 9.
Distributions of head, eye, and gaze orientations for two extreme cases of almost only head contribution to horizontal gaze-shift or almost only head contribution to vertical gaze-shift. We have made the model to plan gaze-shifts from the central fixation point (reference condition) to a uniform distribution of targets on the screen in range (−40, 40) degrees horizontal and (−40, 40) degrees vertical. Eye-in-head (first column in red), head-in-space (second column in green), and eye-in-space (third column in blue) orientations are illustrated. The horizontal (right-left) against the torsional (CW/CCW) diagrams are only included in this figure. The parameters of the model for the first row (A–C) is set to α = 0.05, β = 0.95, and δ = 0.5 while for the second row (D–F) they are set to be α = 0.95, β = 0.05, and δ = 0.5. The black curve shows gaze orientations for targets aligned horizontally on top of the screen.

