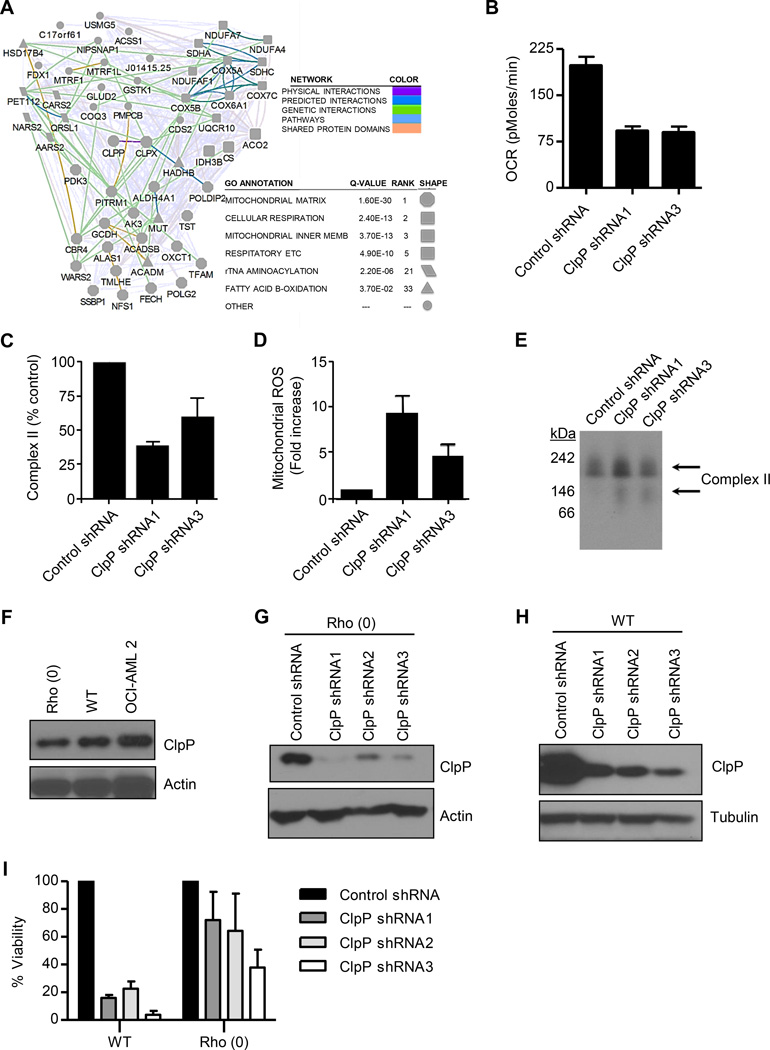
Figure 4. ClpP regulates mitochondrial metabolism.
(A) Network of proteins that interacted with WT or catalytically inactive ClpP.
(B) Effects of ClpP knockdown on basal oxygen consumption (OCR) in OCI-AML2 cells 4 days after transduction with ClpP shRNA or control sequences. Mean ± SD cell counts from one of three representative experiments are shown.
(C) Effects of ClpP knockdown on complex II activity in OCI-AML2 cells 4 days after transduction with ClpP shRNA or control sequences. Percent mean ± SD enzymatic activity from one of 3 representative experiments is shown.
(D) Effects of ClpP knockdown on mitochondrial ROS production in OCI-AML2 cells 4 days after transduction with ClpP shRNA or control sequences. Mean ± SD mitochondrial ROS positive cells from one of three representative experiments are shown.
(E) Effect of ClpP knockdown in OCI-AML2 cells four days after infection with virus expressing shRNA targeting ClpP or control sequences on SDHA expression and migration on a native gel determined by immunoblotting.
(F) Expression of ClpP in total cell lysates prepared from WT and Rho (0) 143B cells and OCI-AML2 cells.
(G, H) The expression of ClpP and β-actin were detected by immunoblotting in WT (G) and Rho (0) 143B (H) cells transduced with individual shRNA targeting ClpP or control sequences.
(I) The number of viable WT and Rho (0) 143B cells was measured by trypan blue staining 12 days after transduction as described in panel F and G. One of 3 representative experiments showing the percent mean ± SD viable cells relative to cells infected with control shRNA is presented.
See also Figure S3 and Table S2.

