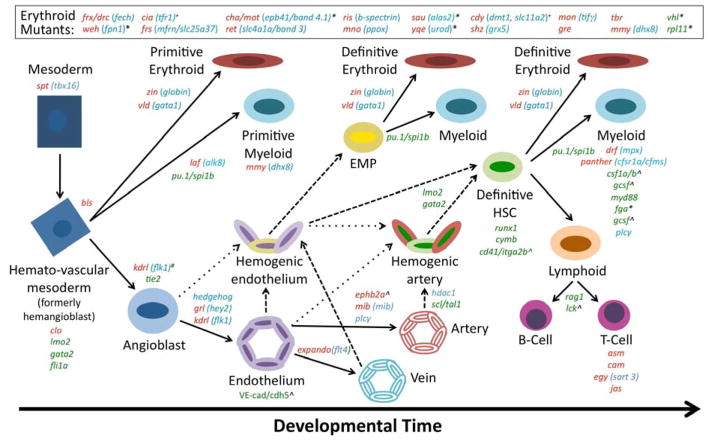
Figure 1. Models for investigating embryonic hematopoiesis in the Zebrafish.
Schematic representation of embryonic hematopoietic development showing lineage relationships between the hemato-vascular populations and available zebrafish mutant lines. Red type indicates mutants derived from forward genetic ENU-screening, with blue font illustrating the genetic lesion; green font represents targeted mutants. An * denotes mutants which recapitulate the disease phenotype associated with human gene mutation(s). A ^ indicates a targeted mutation in a conserved gene that has not yet been phenotypically validated. A # indicates a series of genetic alleles are available. A + notes mutants which exhibit an early embryonic phenotype but are viable as adults.

