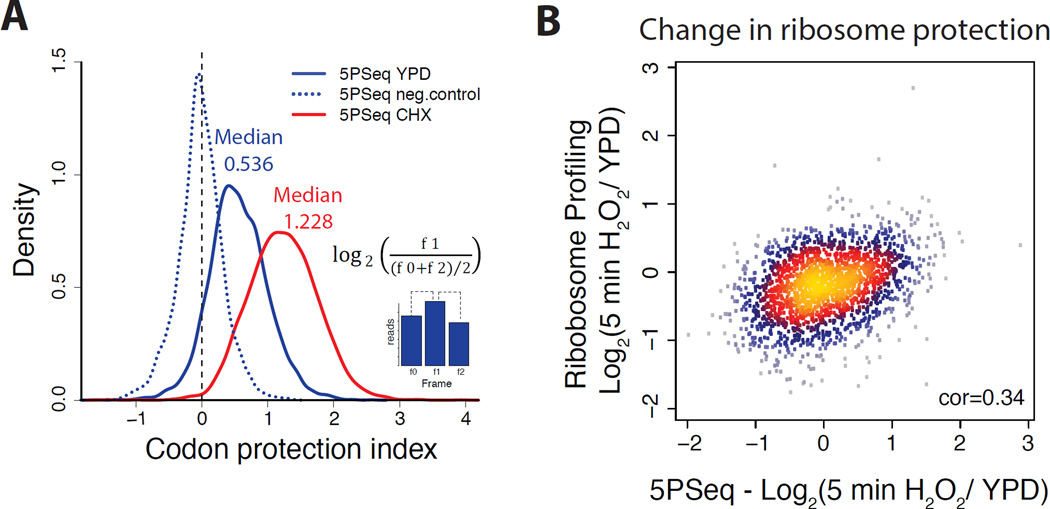
Figure 3. The abundance of co-translational mRNA degradation intermediates reflects translational regulation.
A) Histogram for codon protection index as a measure for co-translational degradation. Codon protection index was computed as the log2 ratio of the reads corresponding to the protected frame (f1) in respect to the average number of reads of the non-protected frames ((f0+f2)/2). This ratio was computed for cells in rich media (blue), after CHX treated (red) and randomly fragmented samples (dotted blue line). Only genes with at least 50 reads were considered for the analysis.
B) Scatter plot comparing the variation of abundance of 5PSeq reads in the body of the gene (xaxis) with the variation of ribosome profiling reads (y-axis) (Gerashchenko et al., 2012) after 5 minutes treatment with H2O2 0.2mM. Spearman correlation coefficient is shown.

