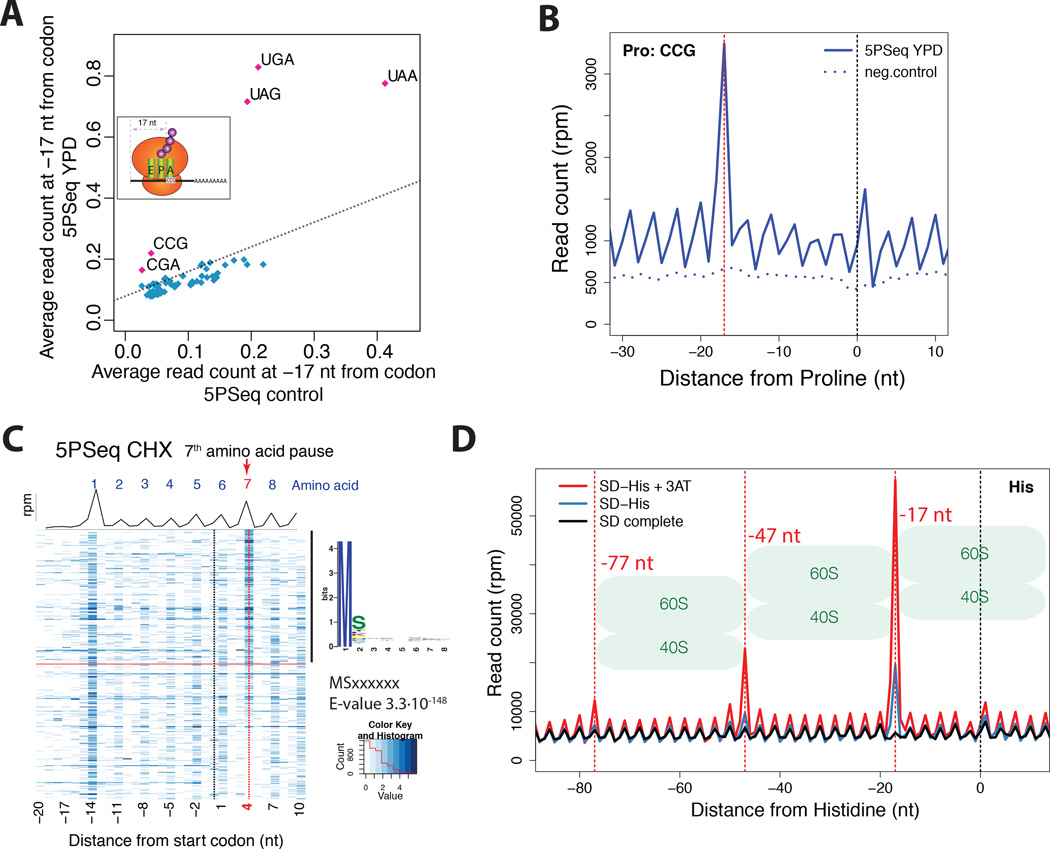
Figure 4. 5PSeq allows exploration of ribosome dynamics at codon resolution.
A) 5PSeq coverage 17 nt upstream of each codon (y-axis) compared with the random fragmented sample (x-axis). Stop codons (UGA, UAG and UAA), CGA (Arginine) and CCG (Proline) present an increased pausing. The dashed line was estimated by comparing the average percentage of reads at frame 1 in all codons between 5PSeq and random fragmented control.
B) Metagene displaying the abundance of 5’P reads in respect to the rare proline codon (CCG) for cells in rich media (blue) and a randomly fragmented samples (dotted blue line). The expected 5’ endpoint protection (−17 nt) is displayed by a dotted red line
C) Metagene representing both the average coverage (black line) and gene-specific coverage (blue heatmap) for cells grown after cycloheximide treatment. Only genes with at least 10 reads in the displayed regions were considered. Genes were sorted by the ratio of reads at position 4 nt (red dotted line) to the reads corresponding to the surrounding +/−2 codons. To identify specific peptide sequences, the first 8 amino acids of the top 50% of genes were compared to the bottom half using MEME (Bailey et al., 2009).
D) Metagene displaying the abundance of 5’P reads with respect to histidine codons for 5PSeq of cells in synthetic defined media (SD, in black), SD media without Histidine (in blue) and SD media without histidine poisoned with 3-AT (in red). At −17, −47 and −77 nt, dotted red lines corresponding to the expected 5' endpoints of protection by a ribosome, disome or trisomes halted at the histidine codon are displayed.

