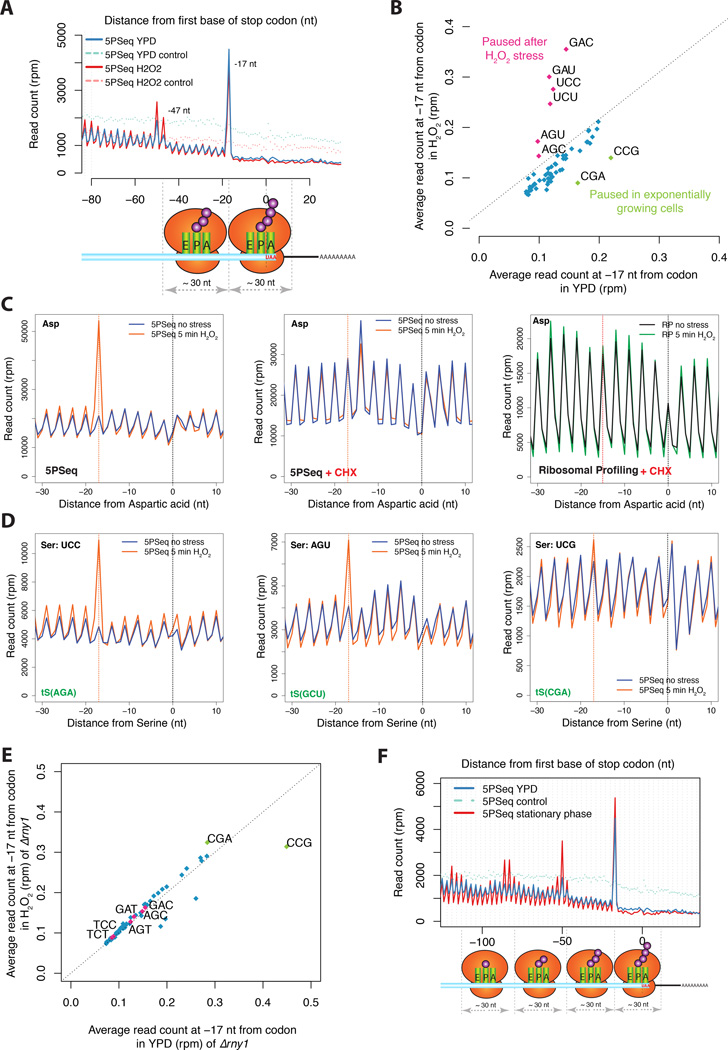
Figure 5. Drug free approach allows the exploration of new ribosome dynamics.
A) Metagene displaying the abundance of 5’P reads with respect to stop codons for 5PSeq of cells in rich media (in blue) or after 5 minutes H2O2 0.2mM treatment (in pink). Randomly fragmened controls are shown in dashed lines.
B) 5PSeq coverage 17 nt upstream of each codon after H2O2 treatment (y-axis) compared to exponentially growing cells (x-axis) as in Figure 4A. Codons paused after stress are highlighted in pink and codons paused in exponential growth are highlighted in green. Only amino acid coding codons are shown.
C) Metagene displaying the Asp specific ribosome pausing after 5 minutes H2O2 0.2mM stress. The clear protection pattern is lost both by the treatment with cycloheximide or if analysed by ribosome profiling (Gerashchenko et al., 2012). The expected 5’ endpoint protection (−17 nt, or −15 for ribosome profiling) is displayed by a dotted red line
D) Upon oxidative stress (orange line) a clear pause can be observed at the codons UCC and AGU, but not at UCG. As shown in panel C.
E) Relative codon pausing after oxidative stress in an rny1Δ strain as shown in Figure 5B.
F) Metagene displaying the abundance of 5’P reads with respect to stop codons in cells grown in rich media (in blue and 5PSeq control in light blue dashed line) or in a saturated culture (5PSeq stationary phase in red).

