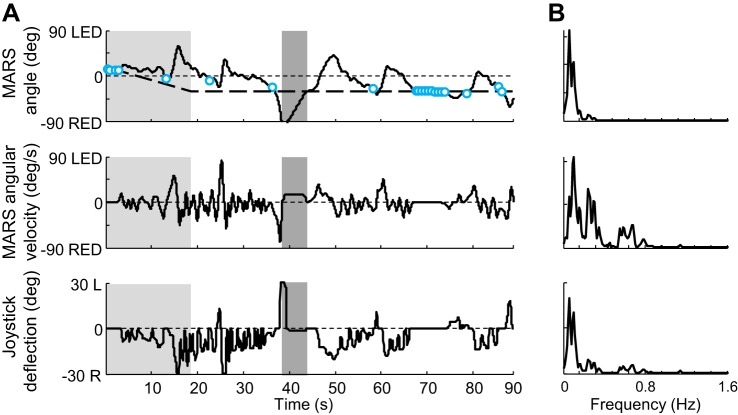
Fig. 3.
Typical trial data. Data from a participant for the “align with the direction of balance” instruction and a DOB of −30°. A: unprocessed, raw data. The solid black lines represent achieved angle (top), angular velocity (middle), and joystick deflection (bottom). The thick dashed black line (long dashes) in the top graph represents the DOB, and the blue dots represent joystick trigger presses when the participant indicated he thought he was aligned with the DOB. Gray shaded regions of the timeline indicate when the DOB was being moved to a new position. Dark gray shaded regions indicate when the participant had lost control and the MARS was being repositioned. The participant is controlling the MARS in the unshaded and light gray shaded regions. The last 45 s of the unshaded region were used for analysis. Positive angles and velocities are left ear down (LED) for the MARS or leftward deflection (L) for the joystick, and negative angles and velocities are right ear down (RED) for the MARS or rightward deflection (R) for the joystick. deg, Degrees. B: power spectral densities of indicated angle, velocity, and joystick deflection.

