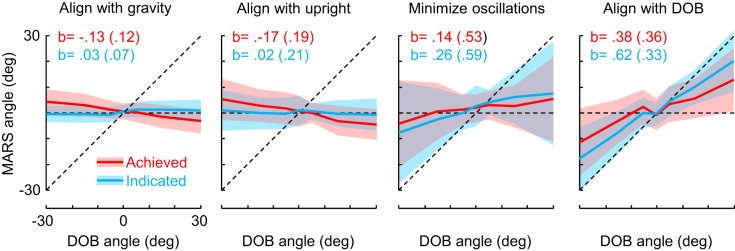
Fig. 4.

Summary data. Achieved (red) and indicated (blue) angles across instructions and DOBs, N = 16. Solid lines show average angles relative to the gravitational vertical across all participants, and shaded areas show standard deviations. Each plot shows the means and standard deviations for slopes, b, of the regressions for individual participants. A horizontal dashed line represents ideal performance for the “align with gravity” and “align with upright” instructions, whereas a diagonal dashed line represents ideal performance for the “minimize oscillations” and the “align with DOB” instructions. Positive DOB angles represent left ear down.
