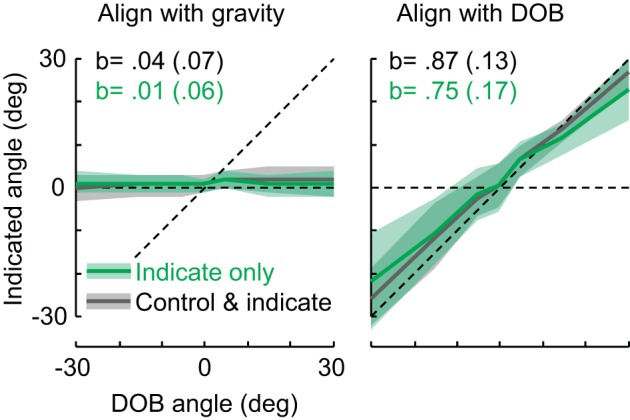
Fig. 7.

Indicated angles across joystick tasks, instructions, and DOBs. Green: passive motion; data from control 2A, N = 6. Gray: active control; data from main experiment, N = 6. Solid lines show average indicated angles relative to the gravitational vertical, and shaded areas show standard deviations. Means and standard deviations for slopes, b, of the regressions are shown.
