
Fig. 8.
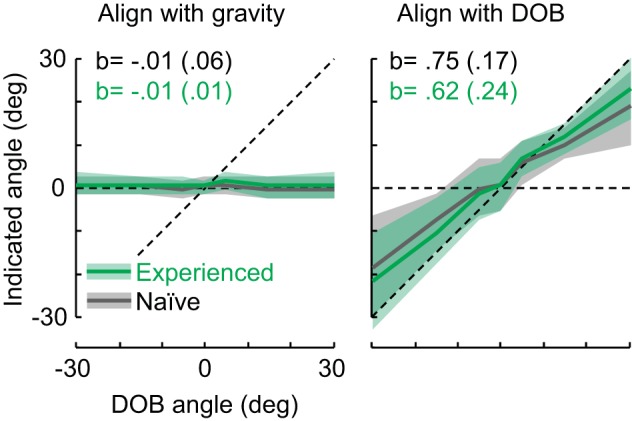
Indicated angles across experience levels, instructions, and DOBs. Gray: naïve exposure; data from control 2B, N = 6. Green: repeated exposure; data from control 2A, N = 6. Solid lines show average indicated angles relative to the gravitational vertical, and shaded areas show standard deviations. Each plot shows the means and standard deviations for slopes, b, of the regressions.