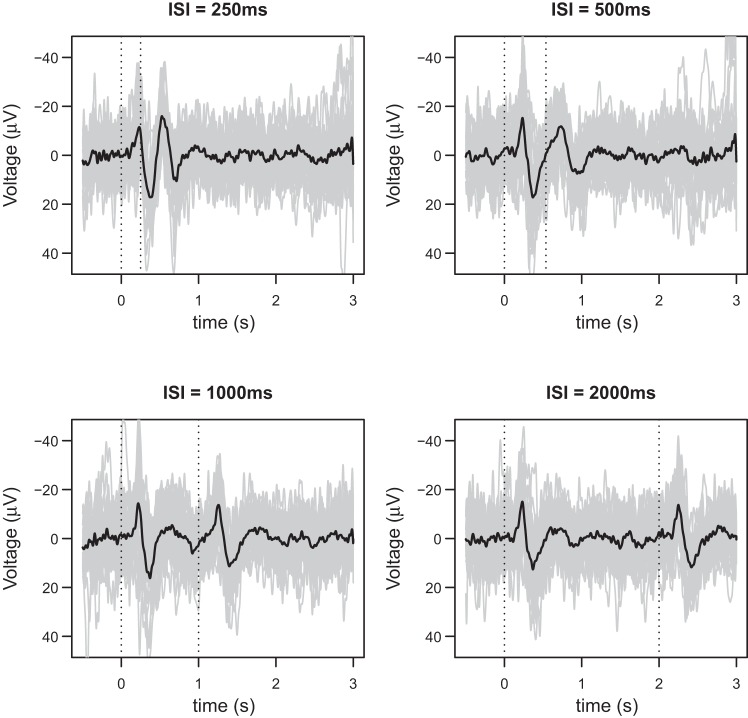
Fig. 1.
The single-trial (gray) and average waveforms (black) from a randomly selected participant. The four figures correspond to the four interstimulus intervals (ISIs) that were considered in the study: 250, 500, 1,000, and 2,000 ms. In each figure there are between 28 and 30 single-trial waveforms. Note the much lower signal-to-noise ratio of single-trial waveforms, compared with average waveforms.

