
Fig. 3.
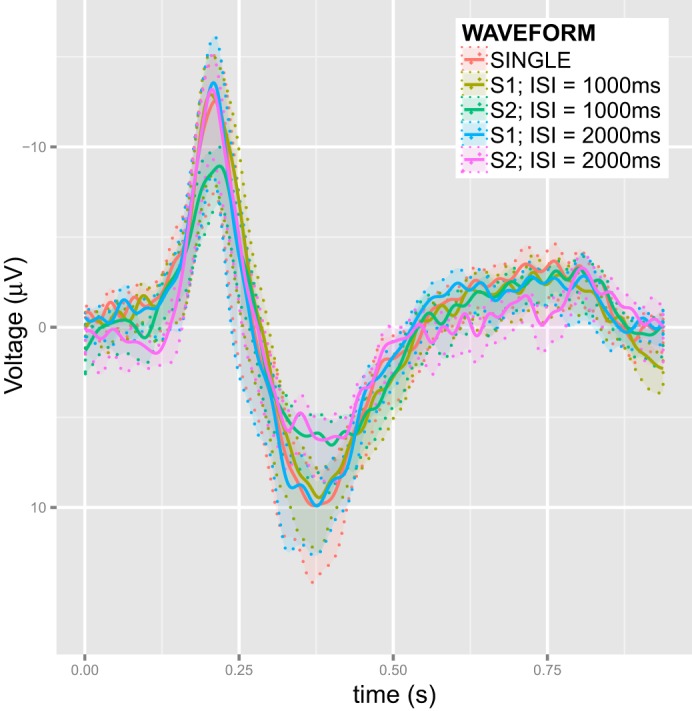
The five ERP waveforms elicited by single stimuli from the SINGLE data and the nonoverlapping ISI = 1,000-ms and ISI = 2,000-ms data. Si denotes stimulus number (i = 1, 2). The waveforms that are presented in the plot are averaged across all trials and subjects in the study. The transparent bands indicate the SE of these averages.