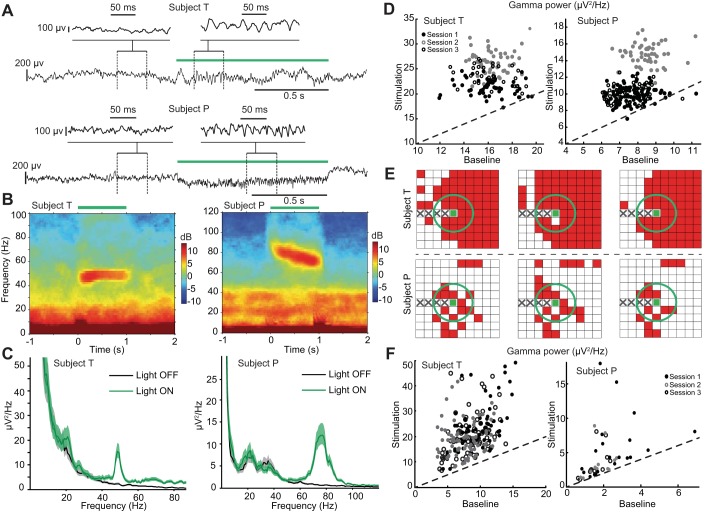
Fig. 2.
Gamma oscillations induced by constant (square) pulse light stimulation. A: low-pass (<300 Hz) filtered local field potentials (LFPs) from 2 representative recording sites in subjects T (top) and P (bottom). Green bar indicates the duration of 1-s square-pulse light stimulation. Insets: zoomed-in LFP signals. B: trial-averaged (n = 54; 1 session) LFP spectrograms for the corresponding LFP channels shown in A for subjects T and P. The spectrograms show clear optogenetically induced narrowband gamma oscillations. In these 2 sessions, induced gamma had a frequency near 50 Hz in subject T, slowed from 80 Hz to 70 Hz in subject P. C: trial-averaged LFP power spectral density (PSD) based on the time interval [0.1, 0.9] s during stimulation (green curve). (The first and last 100 ms were removed to prevent the contributions of any potential artifacts.) Black curve shows PSD computed for a 0.8-s time window preceding the stimulation onset. Shaded areas: 95% confidence intervals (CIs). D: gamma power during stimulation vs. baseline period in each trial. Each data point in the scatterplot shows the gamma band power in 1 trial for the 2 electrodes as in A–C. x (y)-Axis corresponds to power during baseline (stimulation) period. Diagonal line indicates equality. (n = 54, 54, 34 trials in subject T; n = 49, 99, 50 trials in subject P). E: spatial distribution of optically induced gamma activity over the arrays in subjects T and P, all 6 sessions. Red squares indicate channels in which gamma-band LFP power (40–80 Hz) increased during the stimulation period [P < 0.01; random permutation test with false discovery rate (FDR) correction for multiple testing]. Green circle indicates estimated border for direct optical stimulation effects (threshold of 1 mW/mm2; see also Fig. 1D). The 5 electrode sites on left to the stimulation site (including it) were nonrecording sites because of the optical fiber integration. F: gamma power during stimulation vs. baseline period in each electrode. Each data point shows trial-averaged gamma-band power for 1 electrode that has optically induced gamma. Diagonal line indicates equality. Data from 3 sessions of each subject were included.

