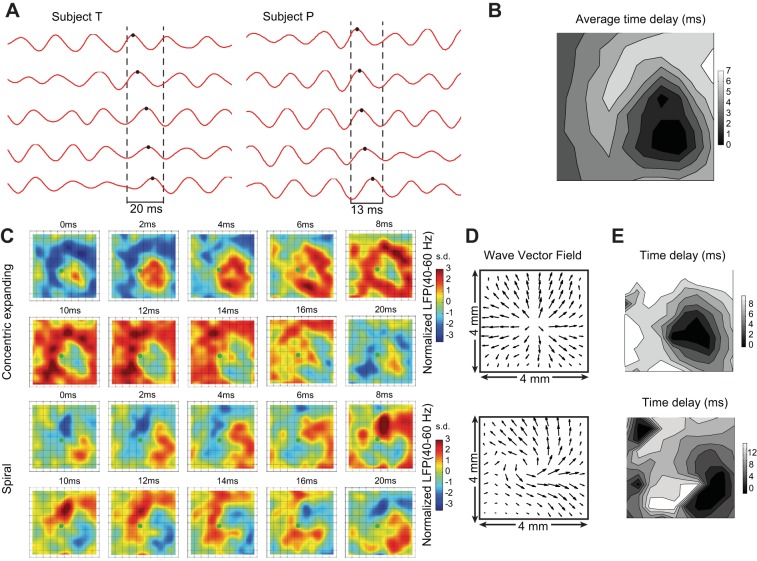
Fig. 4.
Spatiotemporal patterns of optogenetically induced gamma waves. A: during stimulation, gamma-band LFPs (40–60 Hz in subject T, 60–80 Hz in subject P) showed time delays between different electrodes. Black dots indicate the peaks of a gamma cycle in the period between the 2 dashed lines across 5 recording sites on the microelectrode array. B: contour map of time delay at each electrode (subject T) with respect to the electrode with the shortest latency (methods), averaged across all gamma cycles from 54 trials. Five nonrecording sites on left of and including the light stimulation site show interpolated values. C: snapshots of LFP amplitude maps (40–60 Hz, subject T; z-scored, interpolated) during a single gamma cycle of 20 ms. Top: gamma waves propagate in an expanding concentric pattern. Bottom: spiral pattern. The shift of the wave “center” to the right (with respect to the fiber optic location) could have resulted from the actual orientation of the tip of the optical fiber or from differences in opsin expression, for example. (The implantation goal was to have the fiber perpendicular to the cortical layer, but the actual orientation might have been different.) D: different patterns of wave propagation illustrated by the averaged (across frames in a 20-ms cycle) wave vector field evaluated via the Horn-Schunck method (Horn and Schunck 1981) corresponding to the same sets of data shown in C. E: contour map of transient time delay corresponding to the 2 gamma cycles shown in C and D.

