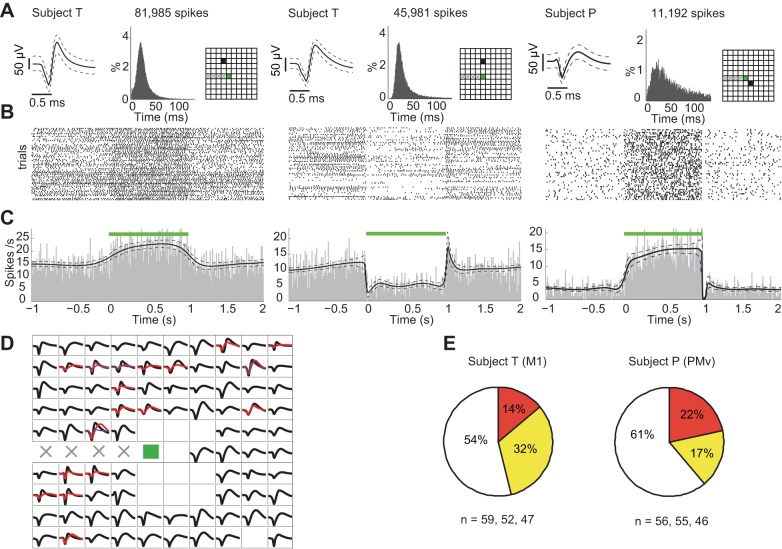
Fig. 5.
Modulation of neuronal spiking rates during optogenetically induced gamma LFP oscillations. A: action potential waveforms, interspike time intervals (ISIs), and recording sites for 3 representative neurons recorded from the 2 subjects are shown. Waveform: mean waveform with dashed line envelope showing the corresponding 95% CI for observed waveform values. The modes of ISI of the 3 units are 23, 26, and 29 ms, respectively. B: corresponding raster plots for each neuron (n = 54 trials). C: corresponding peristimulus time histograms (PSTHs) estimated via Bayesian adaptive regression splines (Kass et al. 2003) showing either substantial increase or decrease in spike rates during optical stimulation. Dashed curves indicate the 95% CIs. D: average waveforms of all recorded neurons on the array (subject T, 1 session). Units on the same electrode are shown in different colors. E: proportion of neuronal recordings that showed an increase (yellow), a decrease (orange), or no change (white) in spiking rates during optical stimulation. (subject T: n = 59, 52, 47 neuronal recordings in 3 sessions; subject P: n = 56, 55, 46 neuronal recordings in 3 sessions.)

