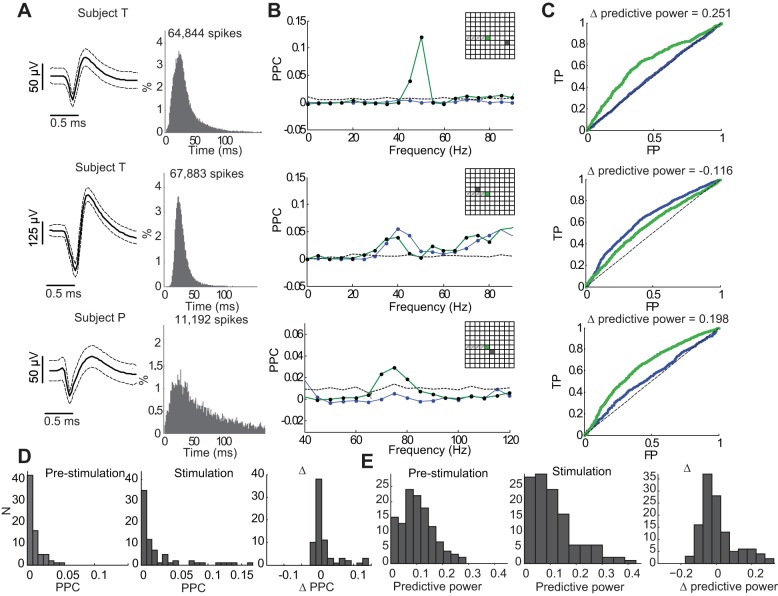
Fig. 6.
Spike-LFP pairwise phase consistency (PPC) analysis and predictive power of optogenetically induced gamma oscillations on neuronal spiking. A: waveforms and ISIs of 3 examples of recorded neuronal spiking. Top 2 neurons were recorded in subject T and bottom neuron in subject P. B: corresponding PPC analysis quantifying the phase-locking of neuronal spiking to LFP oscillations during the 1 s before light stimulation (blue) and during the 1-s optical stimulation period (green). Dashed line shows 95% CI for the PPC chance level (methods). In these 3 examples, all neurons showed some level of significant PPC, although weak (PPC = 1 indicates perfect phase-locking) in the corresponding gamma band during optical stimulation. Insets show position of electrode. C: receiver operating characteristic (ROC) curves assessing prediction of spiking for the corresponding 3 neurons using a point process model where the instantaneous rate (intensity) was modeled as a function of the amplitude envelope and phase of the optogenetically induced gamma oscillations (methods). Diagonal dashed line indicates chance-level prediction. TP (FP) denotes true (false) positive rates. Blue and green ROC curves correspond to the baseline and stimulation periods, respectively. D: summary of gamma oscillation PPC over subjects, sessions, and neuronal recordings (N = 45, 30, and 22 neuronal recordings in 3 sessions for subject T, respectively and N = 13, 5, and 5 for subject P, respectively. Only neurons where the same recording site showed induced gamma oscillations were included.) E: gamma predictive power analysis over the same set of data as in D.

